Meetup 1: Data Science Workflow and Toolkit

George I. Hagstrom

2025-08-25

What is Data Science?

  • Data science is a “discipline that allows you to transform raw data into understanding, insight, and knowledge”
  • I hear often: “Data Science is just statistics with a clever brand name”
  • Is this a misconception?

Data Science Workflow

Consider this visualization of the process for converting raw data into knowledge:
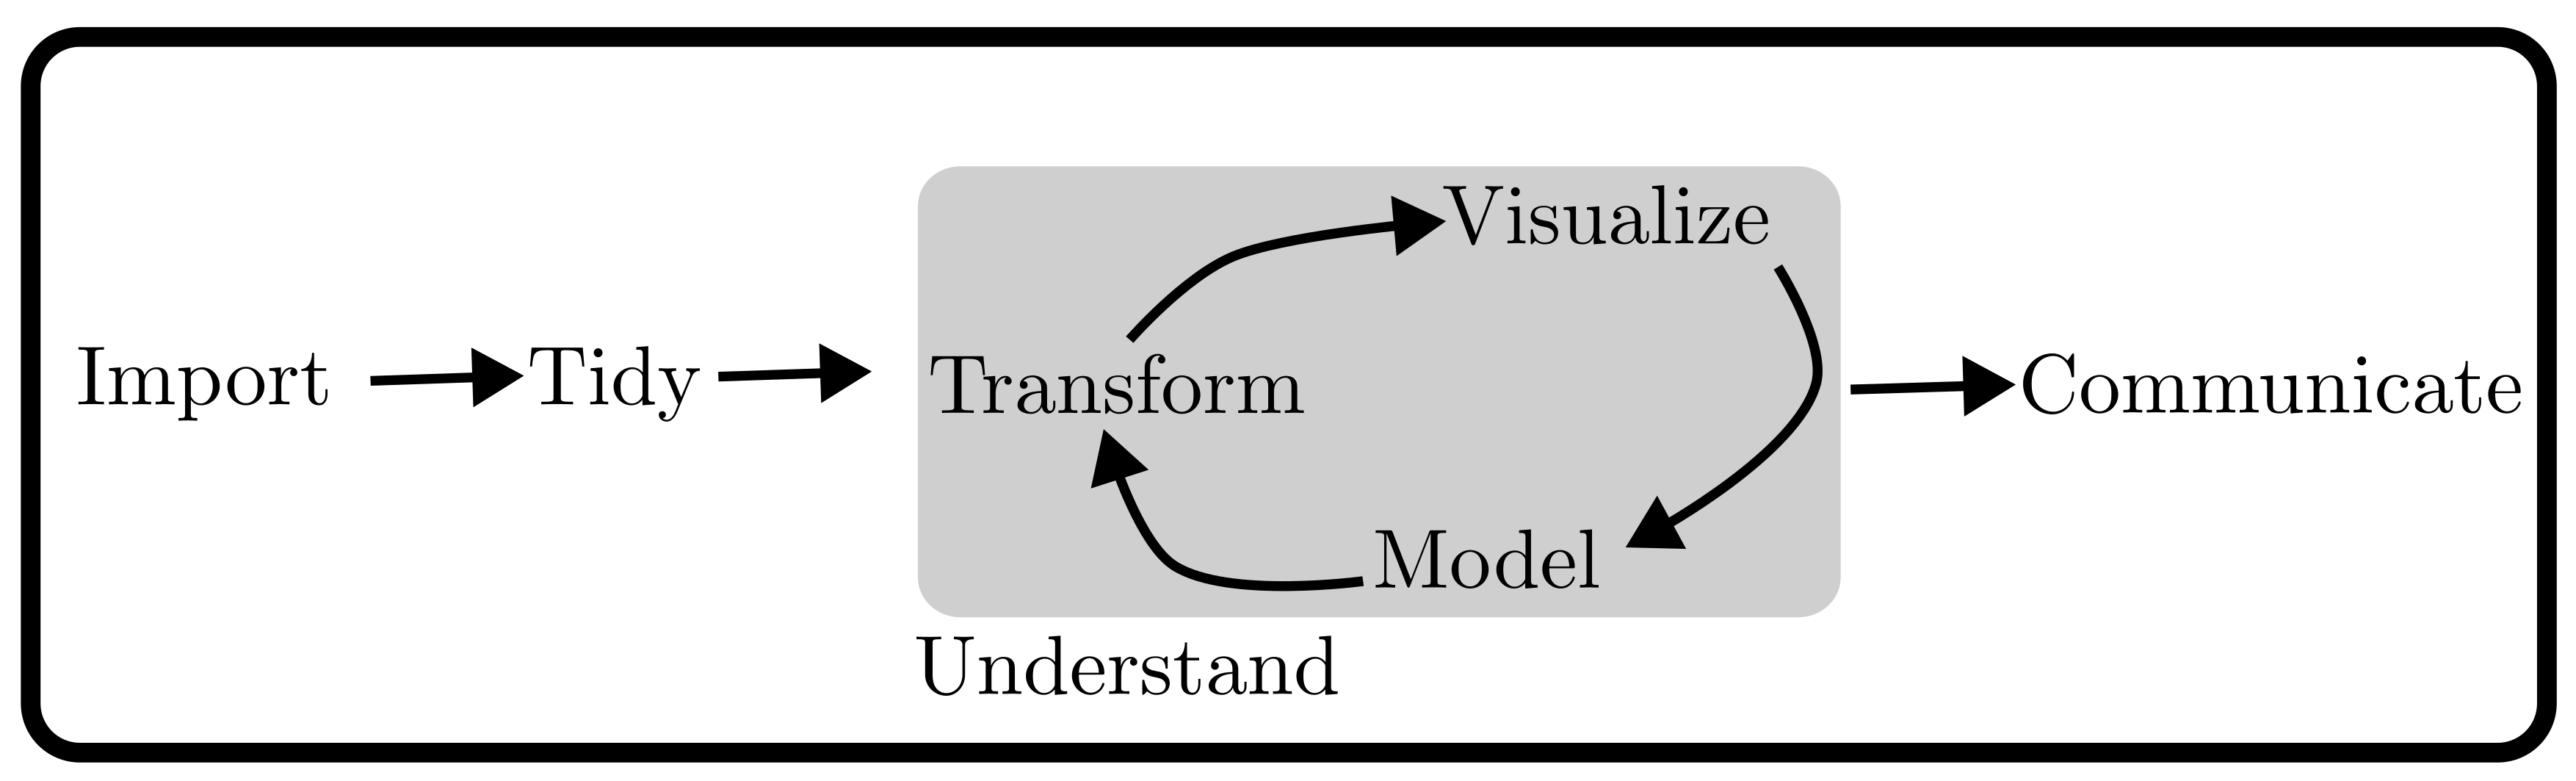
Figure from text

Data Science Workflow

Consider this visualization of the process for converting raw data into knowledge:
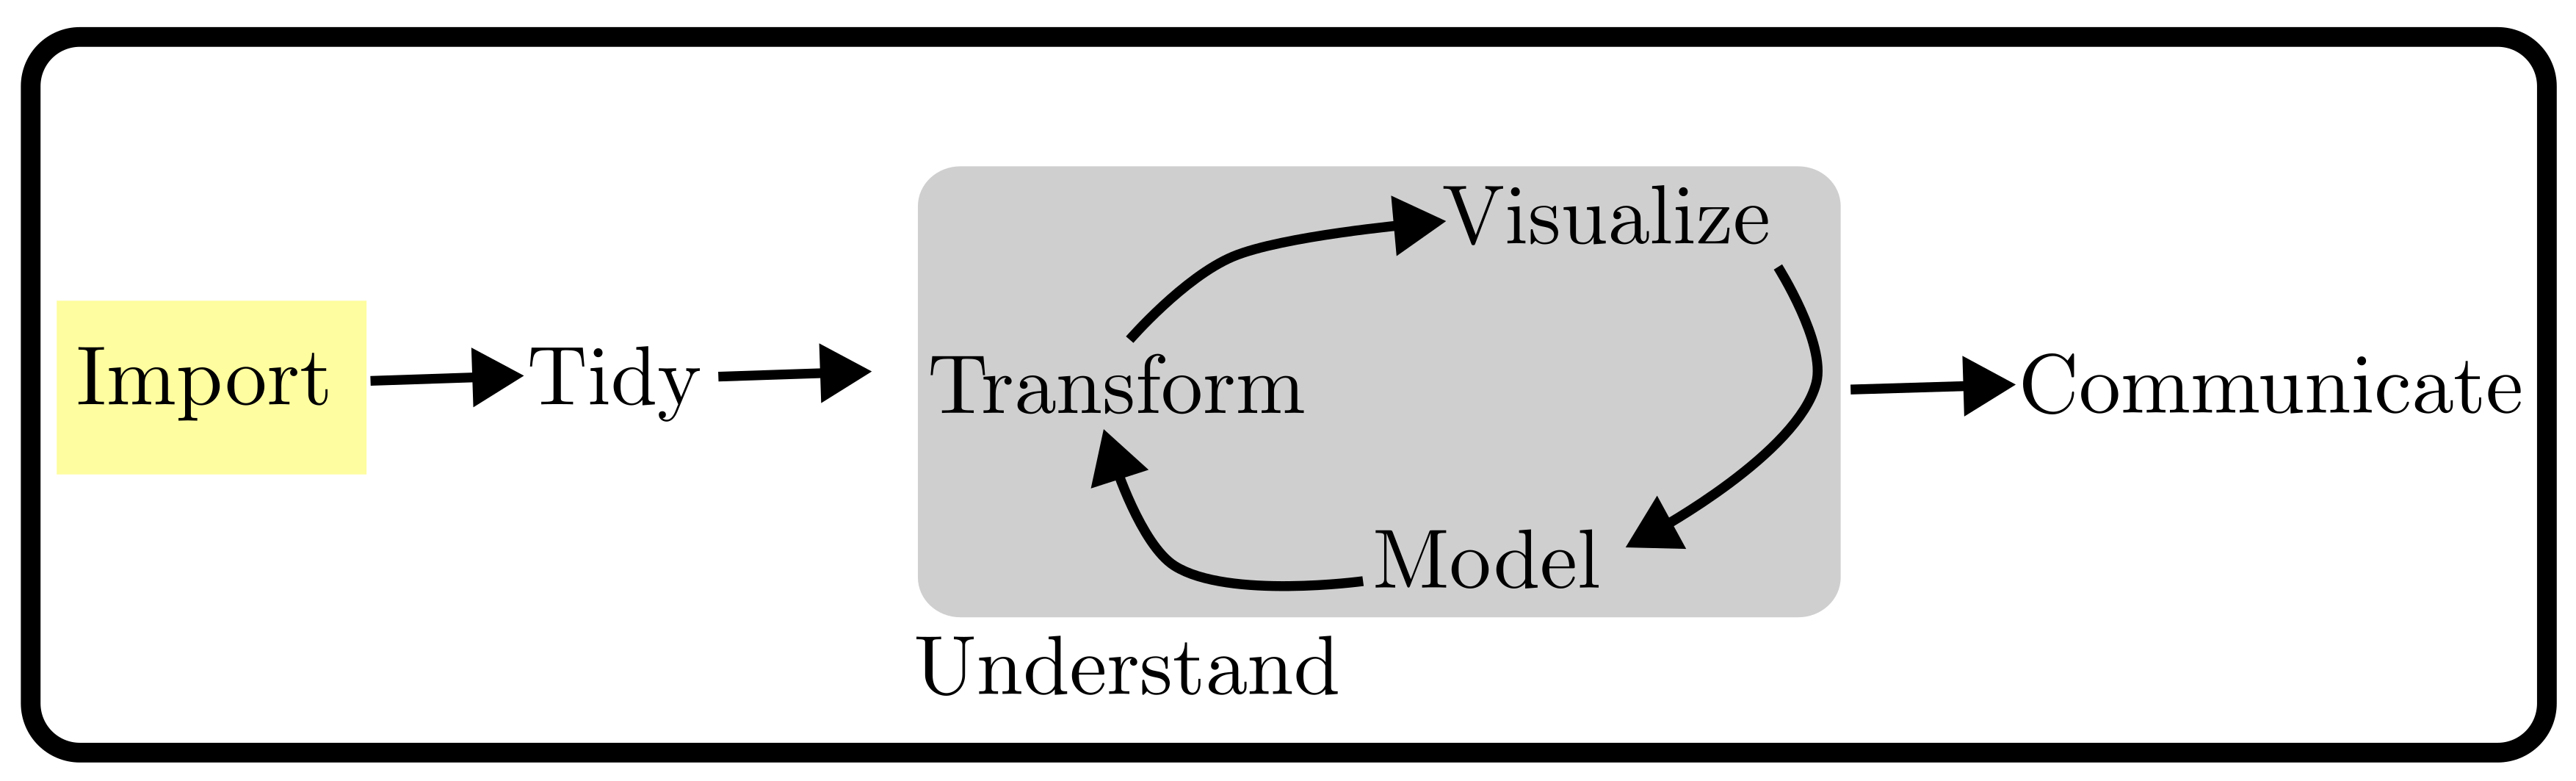
Figure from text

Load the data from files into software

Data Science Workflow

Consider this visualization of the process for converting raw data into knowledge:
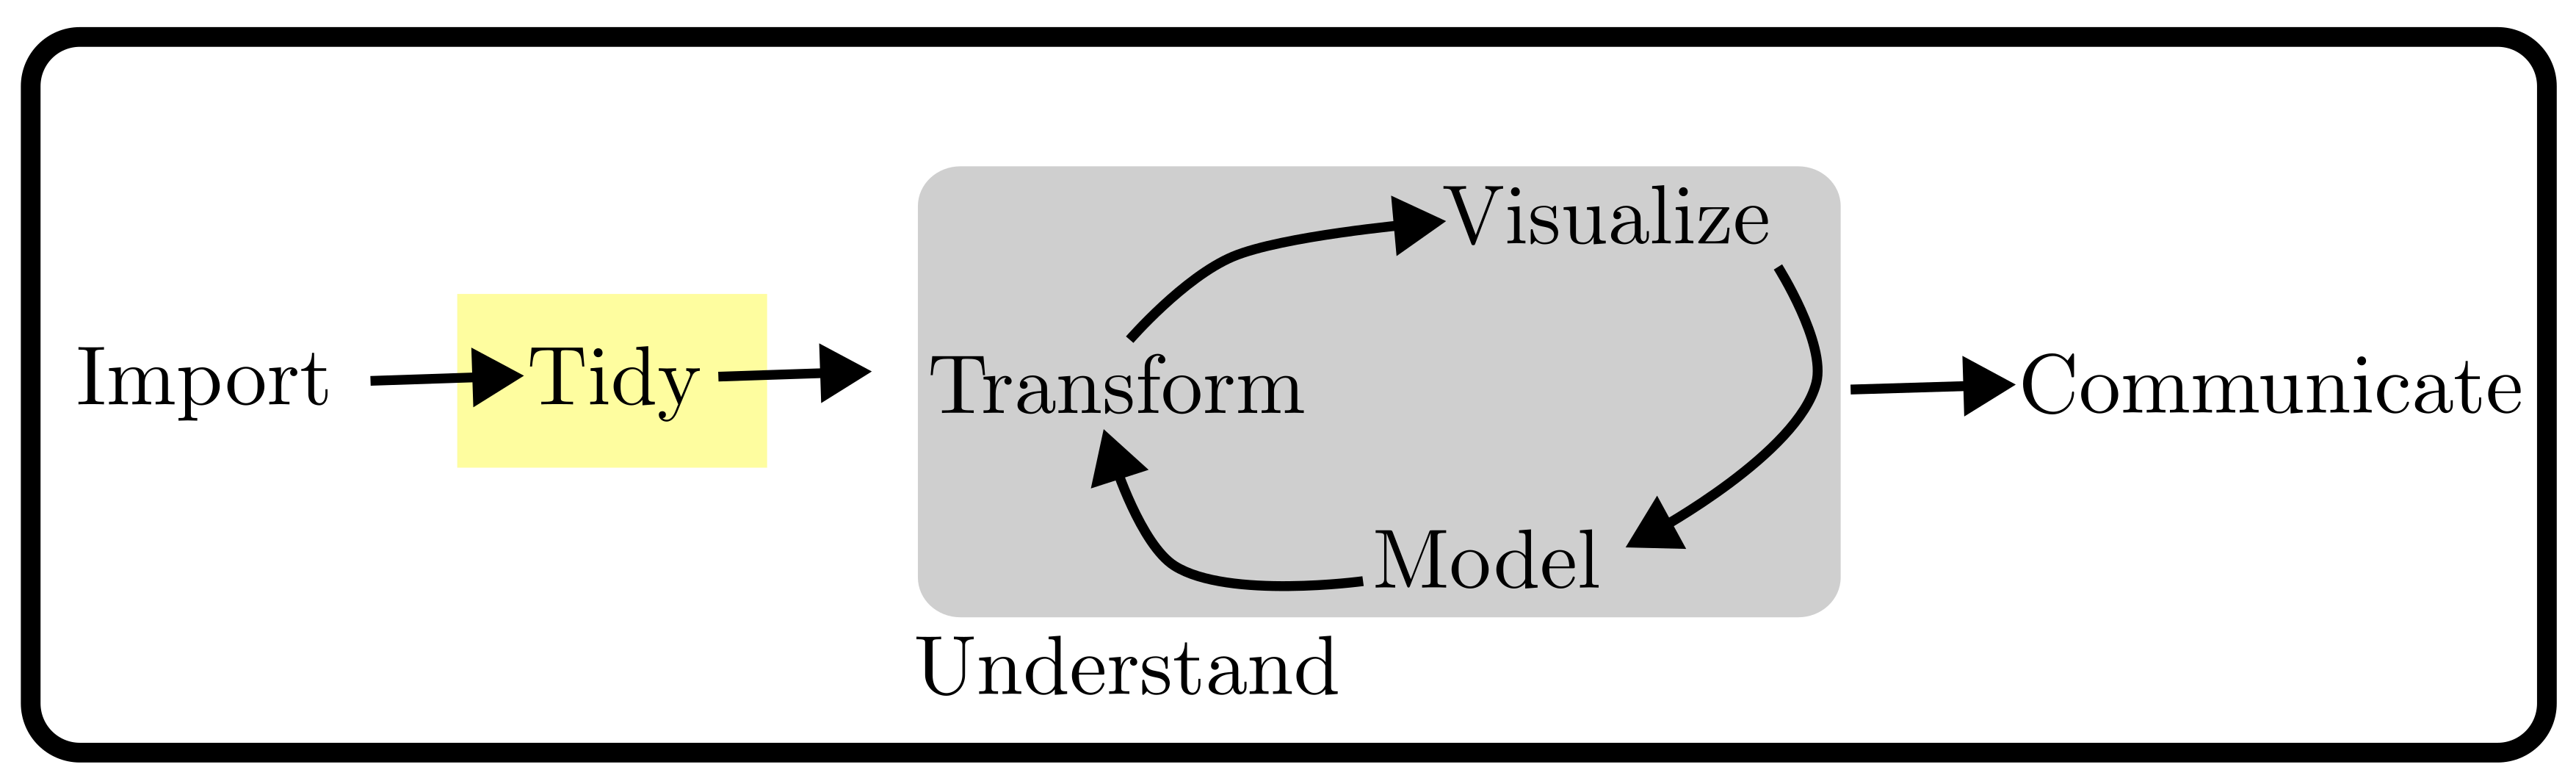
Figure from text

Tidy the data so it is stored in a consistent way

Data Science Workflow

Consider this visualization of the process for converting raw data into knowledge:
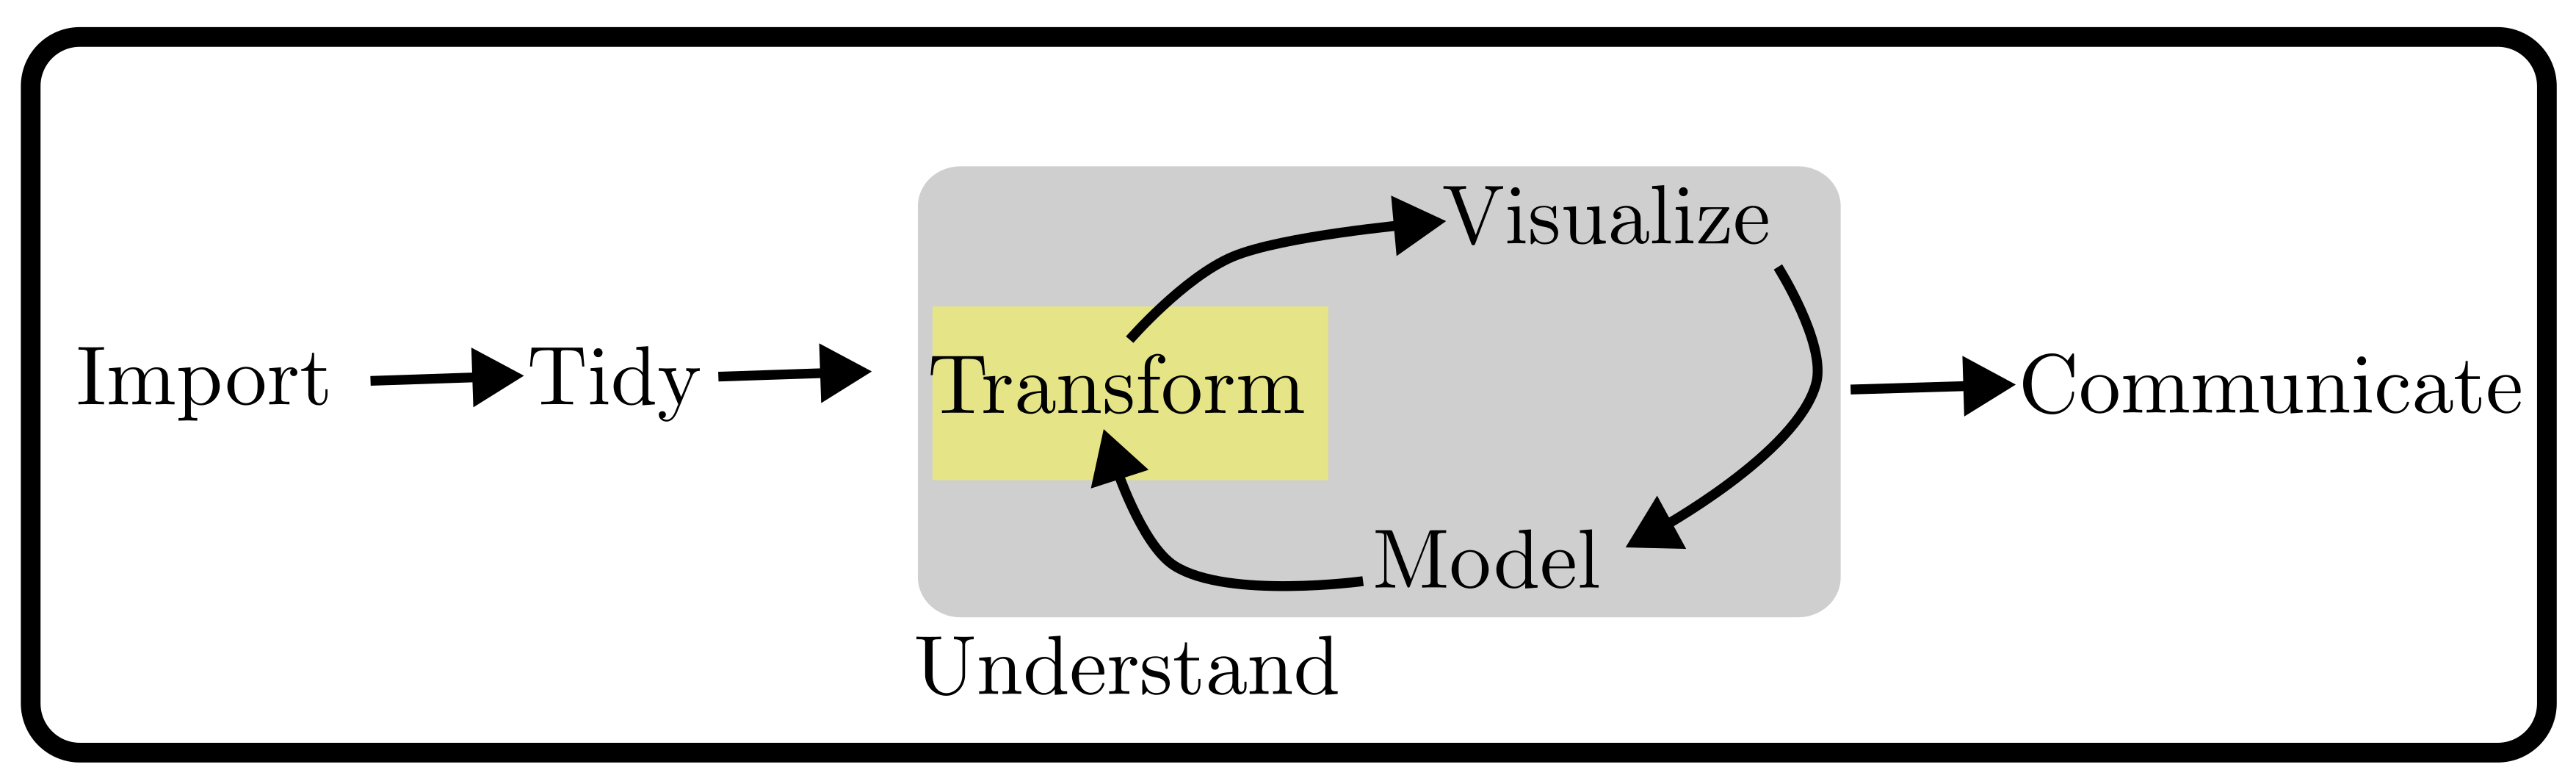
Figure from text

Transform the data to focus our analysis on observations of interest

Data Science Workflow

Consider this visualization of the process for converting raw data into knowledge:
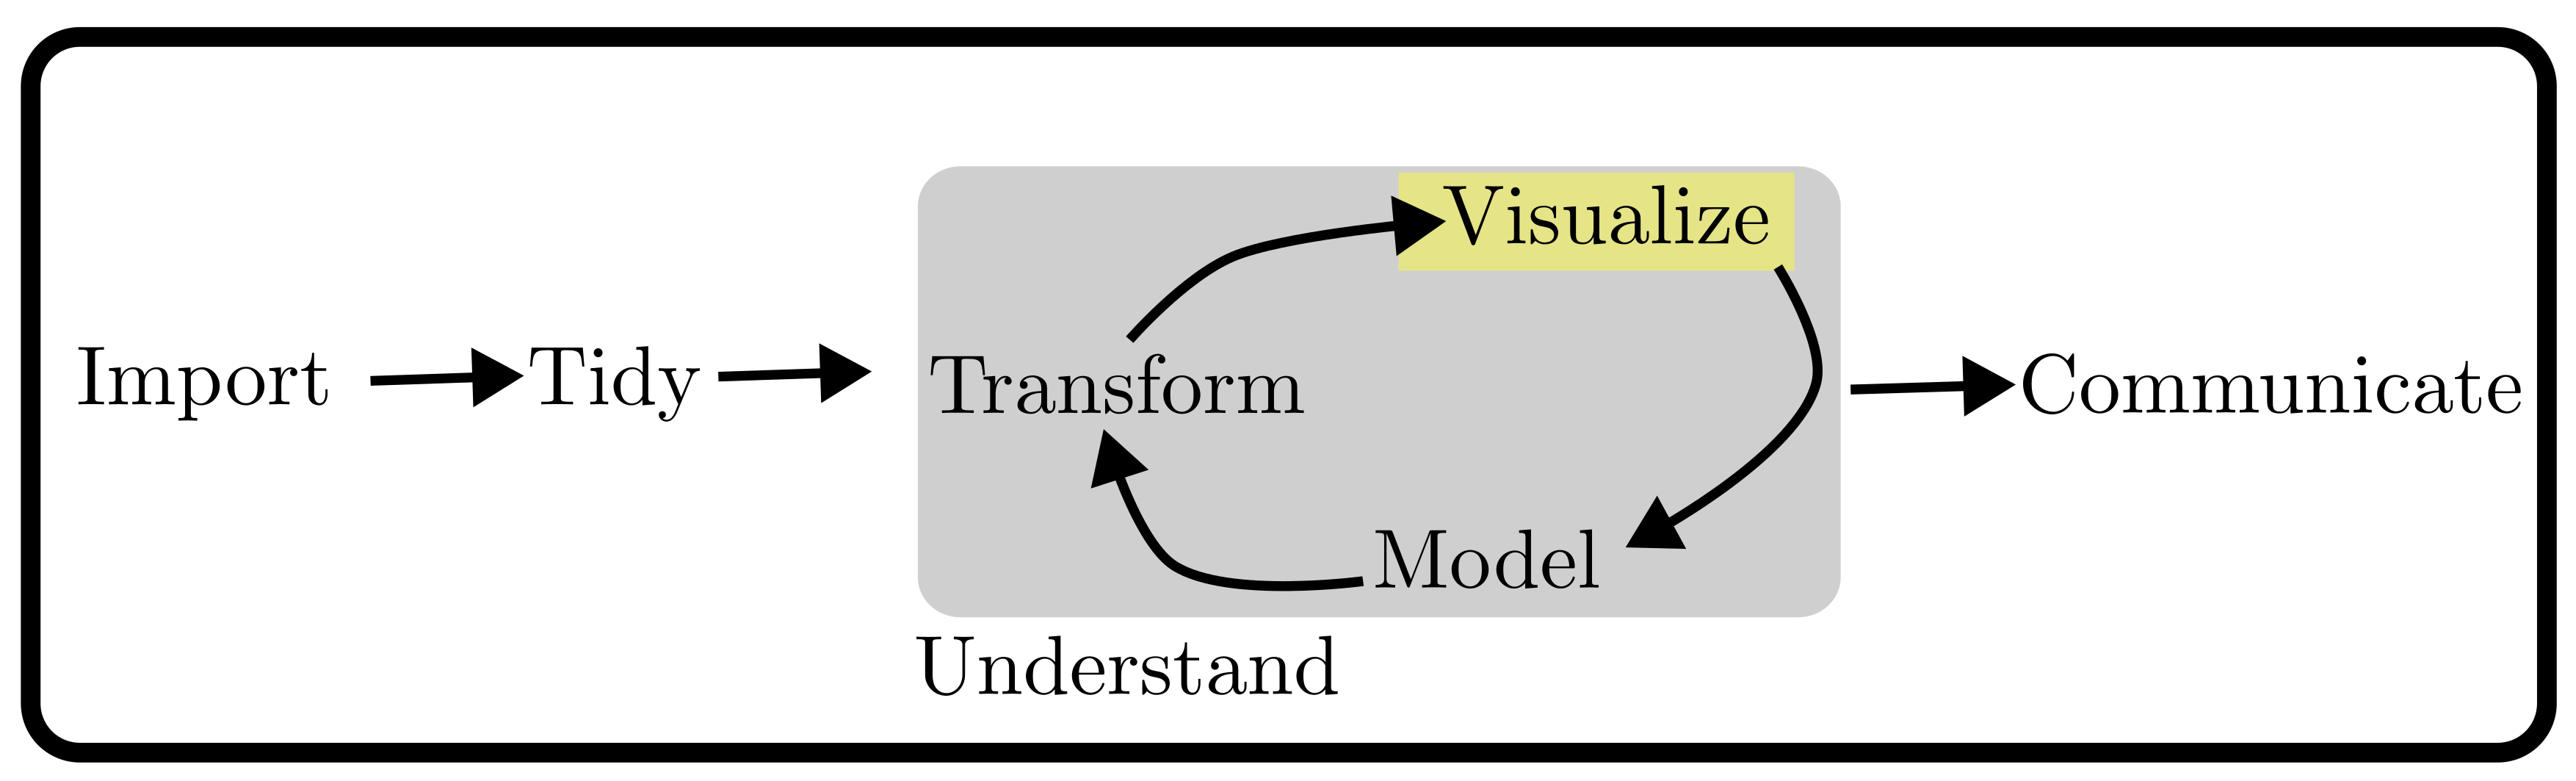
Figure from text

Visualize the data to find relationships, problems, and pose questions

Data Science Workflow

Consider this visualization of the process for converting raw data into knowledge:
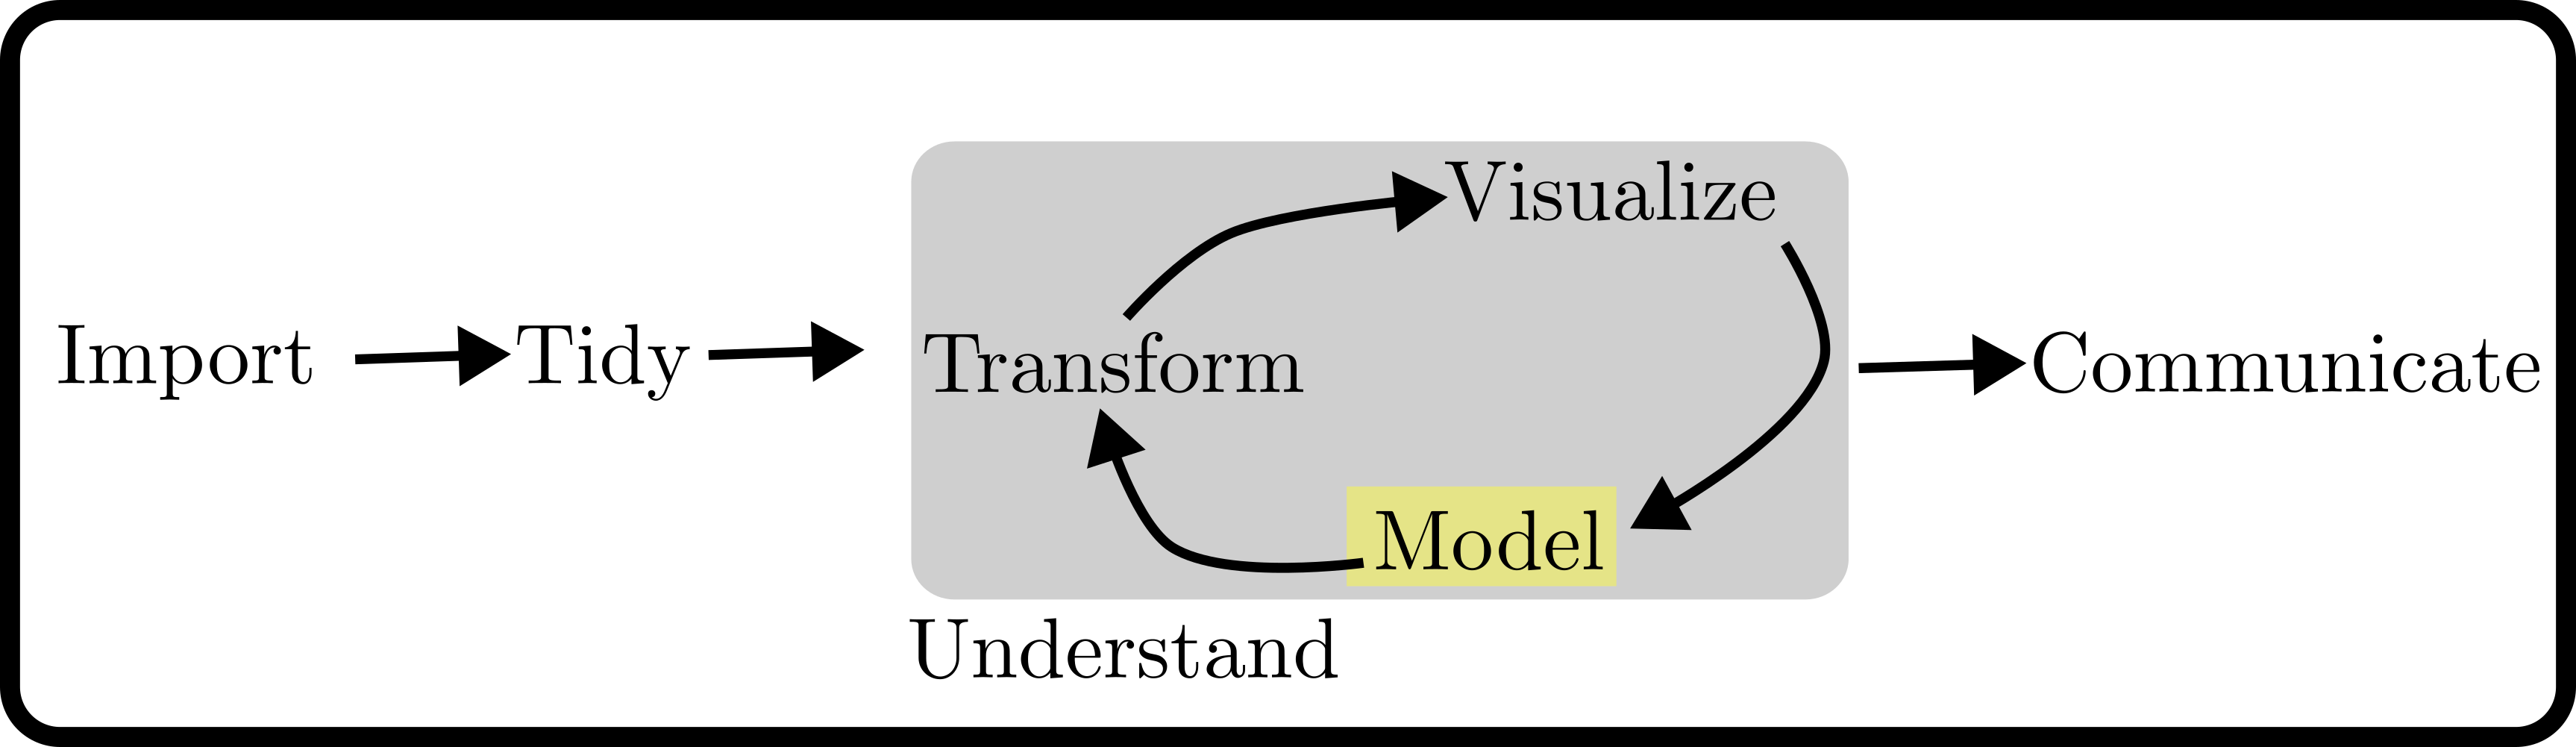
Figure from text

Model the data to answer questions precisely using statistics

Data Science Workflow

Consider this visualization of the process for converting raw data into knowledge:
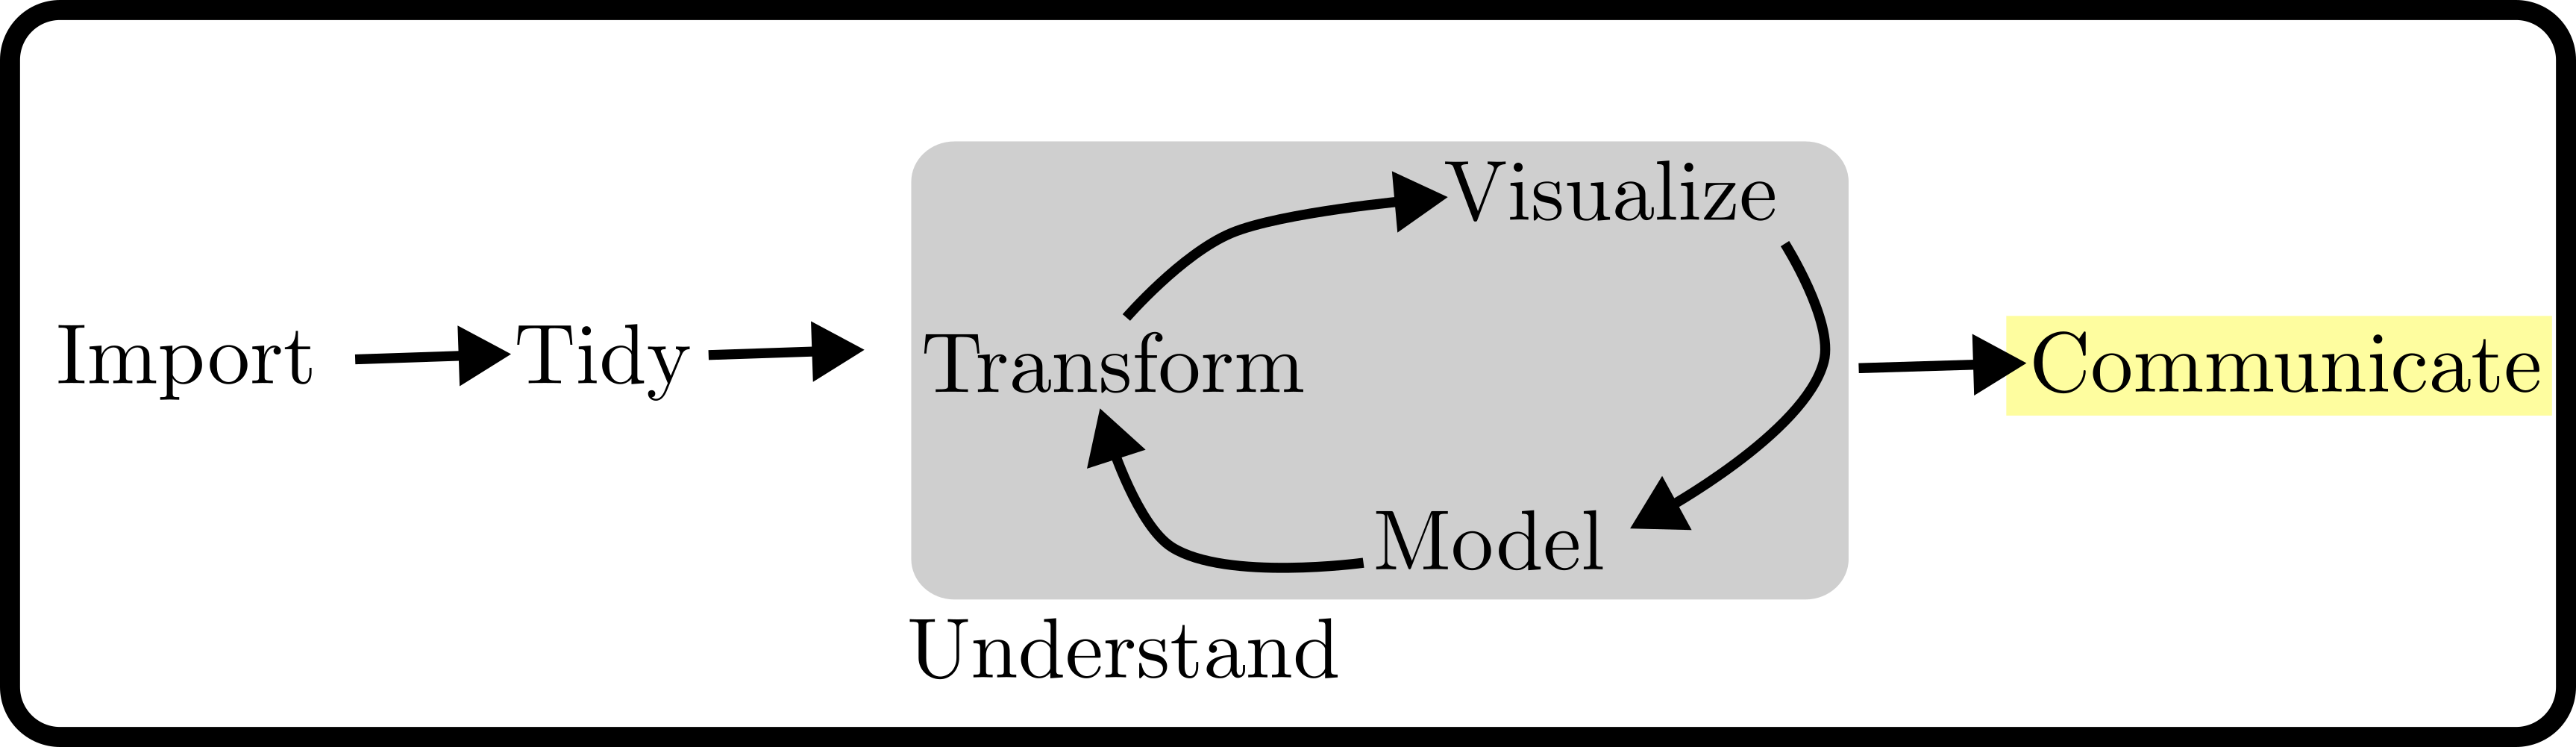
Figure from text

Communicate to share results with others

Data Science Workflow

Consider this visualization of the process for converting raw data into knowledge:
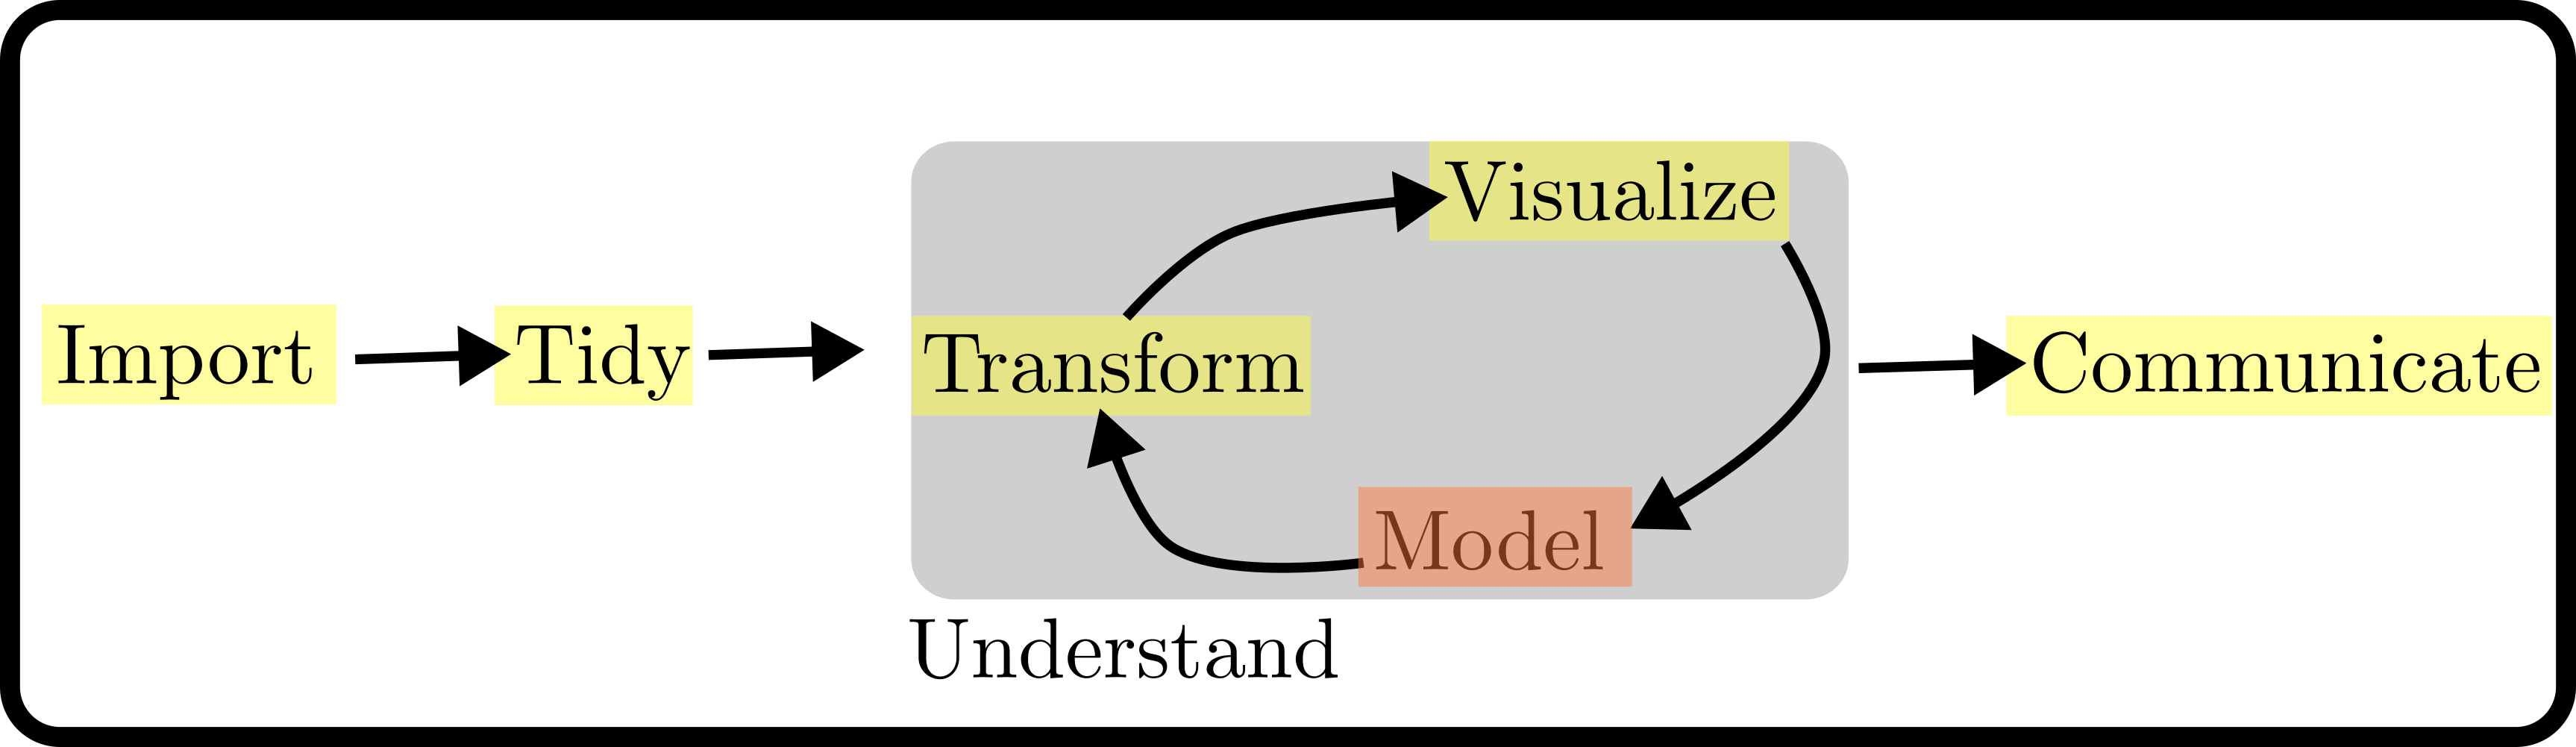
Figure from text

This class will focus on everything but modeling, i.e. the part of Data Science that isn’t statistics

Modeling can be small part of Data Science projects

It is said that 80% of time in data science projects is spent on data mining, cleaning, tidying, exploratory data analysis, etc
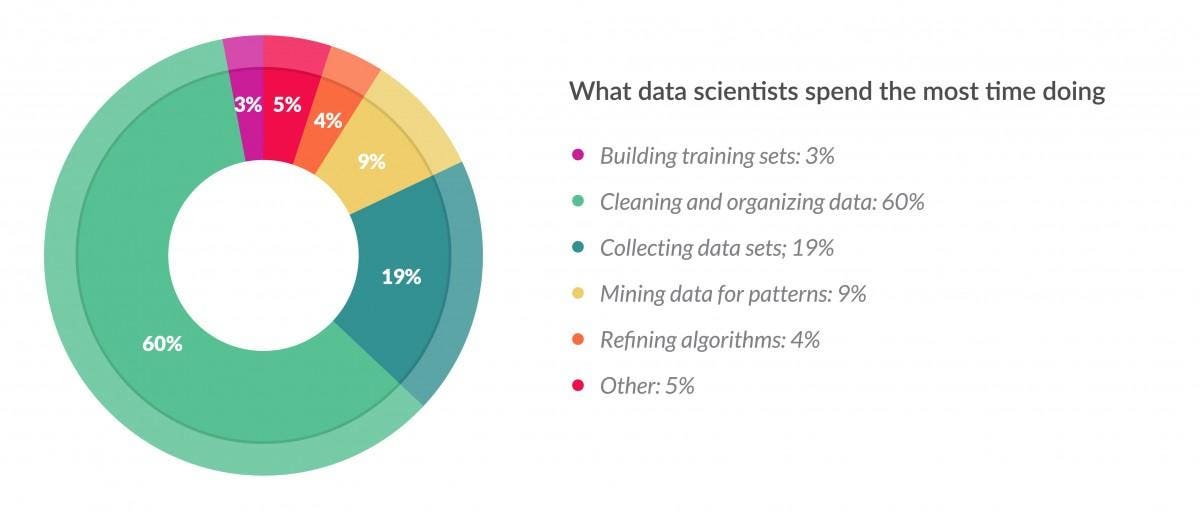
Figure from Forbes

Please forgive the Pie Chart

Intro/Case Study
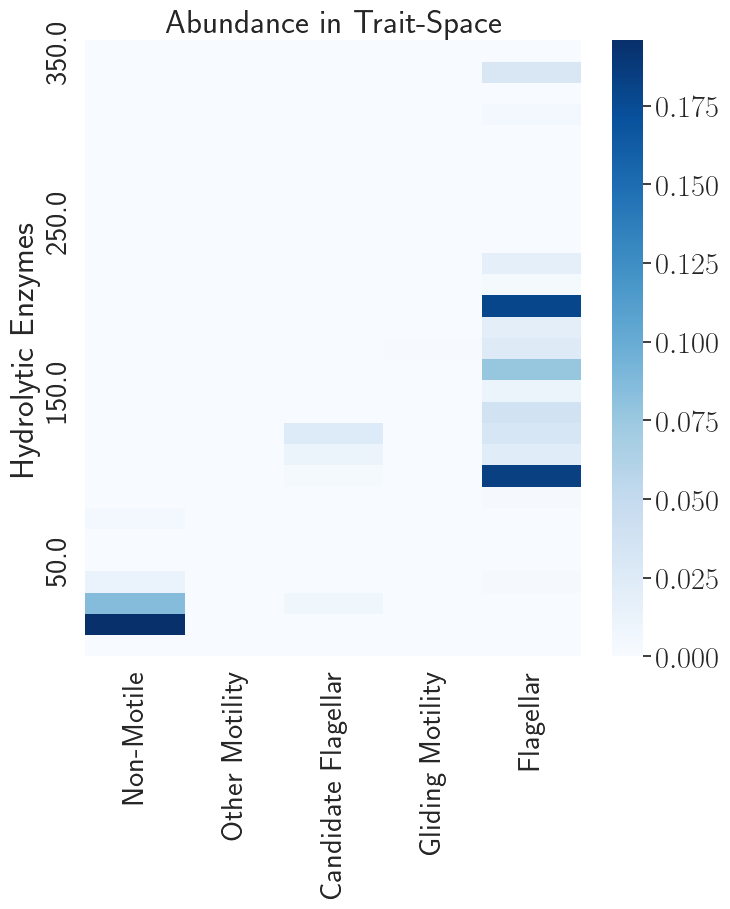
Trait Correlations in Marine Bacteria
  • Data on how bacteria get their food in the ocean
  • Getting data for this plot took months…..
  • Many sources, data formats, quality issues, processing

By the end of the course:

  • Find data you need and do all steps to prep it for analysis
  • Build expertise in R and the tidyverse
  • Use and understand relational databases and SQL
  • Collaborate with Git and GitHub
  • Introduce you to distributed computing and other tools for large datasets
  • Improve your programming ability
  • Know how to use LLMs to serve your goals

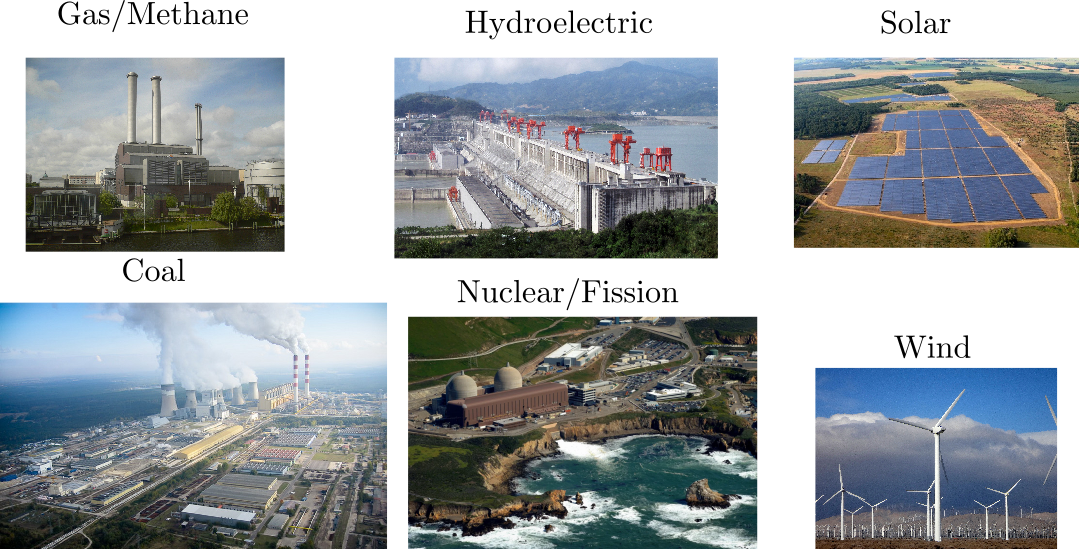
Vignette: Electricity and CO2

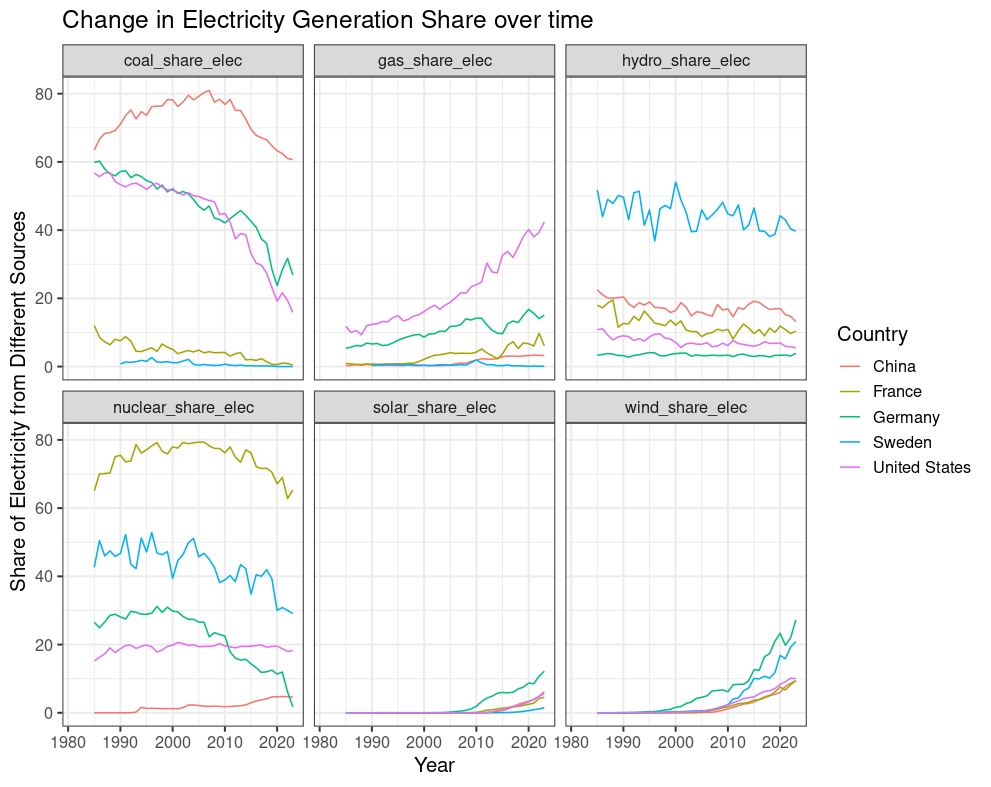
Sources of Power, refs last slide

Electricity Generation Over Time
Source: Our World in Data

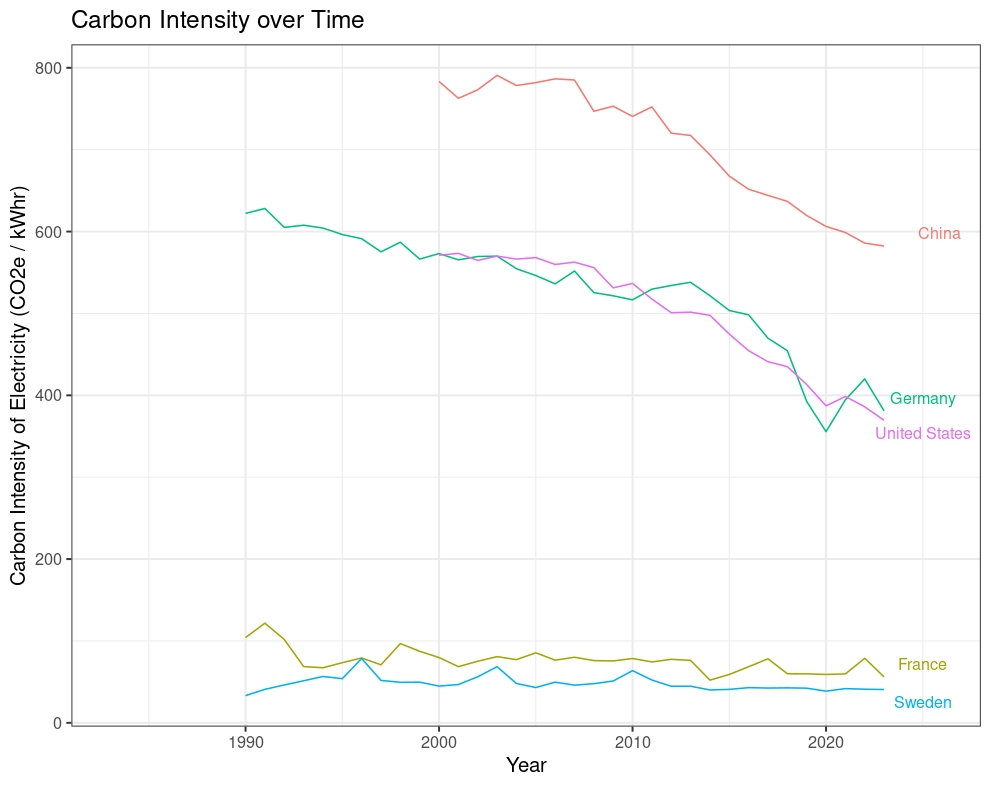
Carbon Intensity of Electricity
Source: Our World in Data

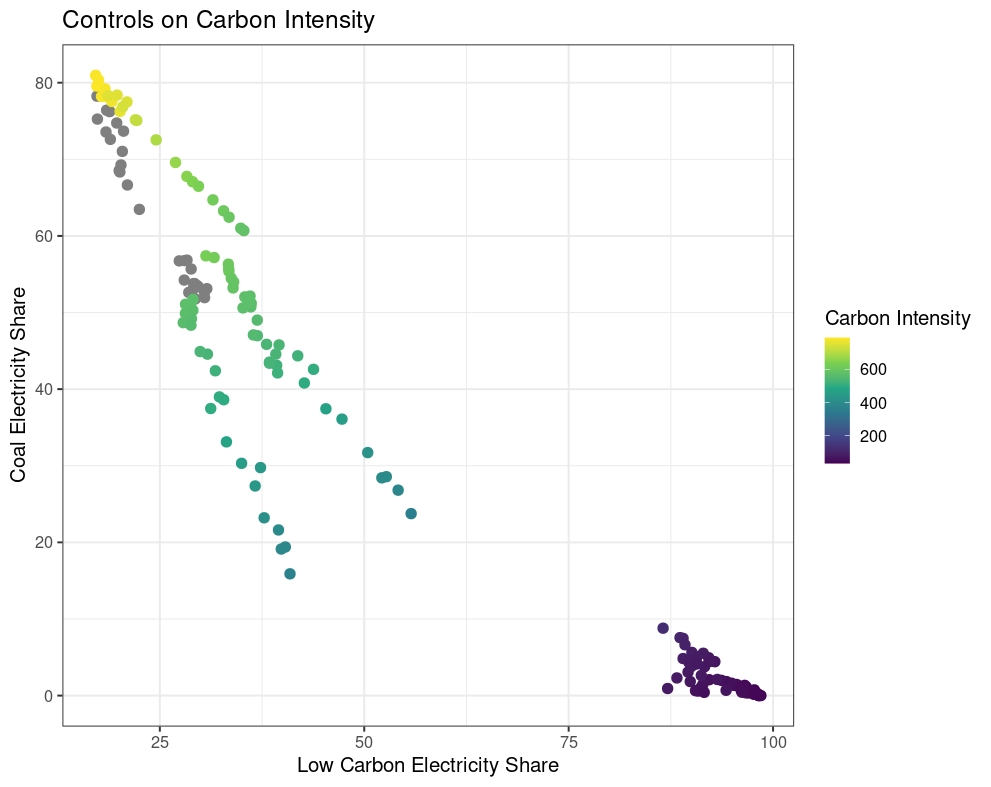
Controls on Carbon Intensity
Source: Our World in Data

Syllabus and Course Site

  • Full Syllabus on the course website:
  • Use the Brightspace page to submit assignments, in pdf format

Meetups

Assignments

  • Labs (50%): Weekly Programming assignments
  • TidyVerse Recipes (10%): Collaborative intro to Git
  • Project (25%)
    • Assemble and explore a data set of your choosing
    • Explore your interests, build your portfolio!
  • Data Science in Context Presentation (5%)
    • One 5 minute presentation, sign up for your presentation slot asap!
  • Meetup Reflections and Introduction (10%)

How to do your homework

  • Quarto Markdown Format
    • Contains both code and content
  • Templates on the website
  • Submit a pdf and qmd file
---
title: "Lab 7: Rectangling and Webscraping"
format: pdf
editor: source
---
  • html files do not contain figures, so I won’t be able to see them if you submit an html!

Research on LLMs in Education

Research on LLMs in Education

Abstract

In the age of generative AI and ubiquitous digital tools, human cognition faces a structural paradox: as external aids become more capable, internal memory systems risk atrophy. Drawing on neuroscience and cognitive psychology, this paper examines how heavy reliance on AI systems and discovery-based pedagogies may impair the consolidation of declarative and procedural memory – systems essential for expertise, critical thinking, and long-term retention. We review how tools like ChatGPT and calculators can short-circuit the retrieval, error correction, and schema-building processes necessary for robust neural encoding. Notably, we highlight striking parallels between deep learning phenomena such as “grokking” and the neuroscience of overlearning and intuition. Empirical studies are discussed showing how premature reliance on AI during learning inhibits proceduralization and intuitive mastery. We argue that effective human-AI interaction depends on strong internal models – biological “schemata” and neural manifolds – that enable users to evaluate, refine, and guide AI output….

What I have Seen

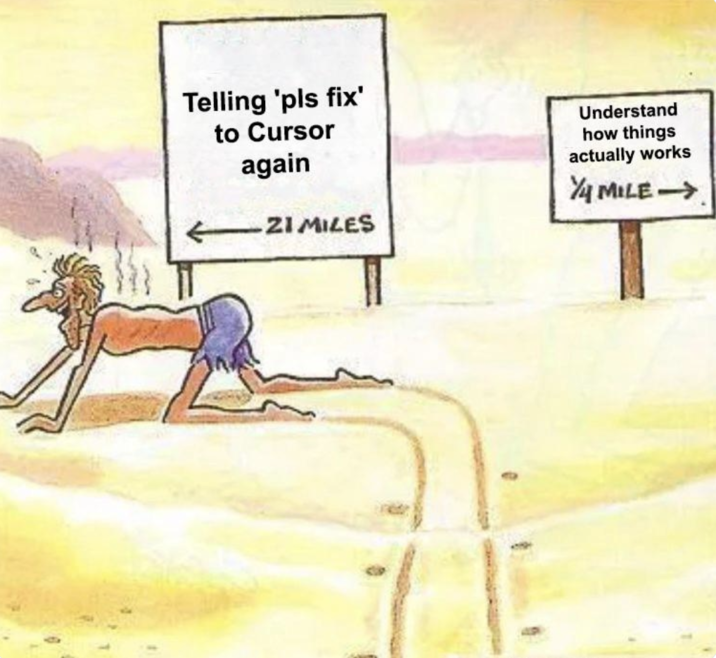
  • Do not let yourself become reliant on LLMs

My Recommendations

  • Ask LLMs how something works
  • Use LLMs for things you can easily check that are low stakes
  • Use LLMs to check for grammar issues, to reword a sentence you struggle with
  • Understand model differences and use professional tools (You can get 1 year free of google AI Pro…)
  • Experiment!

My recommendations

  • Don’t copy and paste
    • Type by hand LLM generated code, understand how it works, maybe even delete it and try to recreate it
  • Don’t use it to write or analyze for you
    • Writing is thinking
  • Don’t turn in something you don’t understand

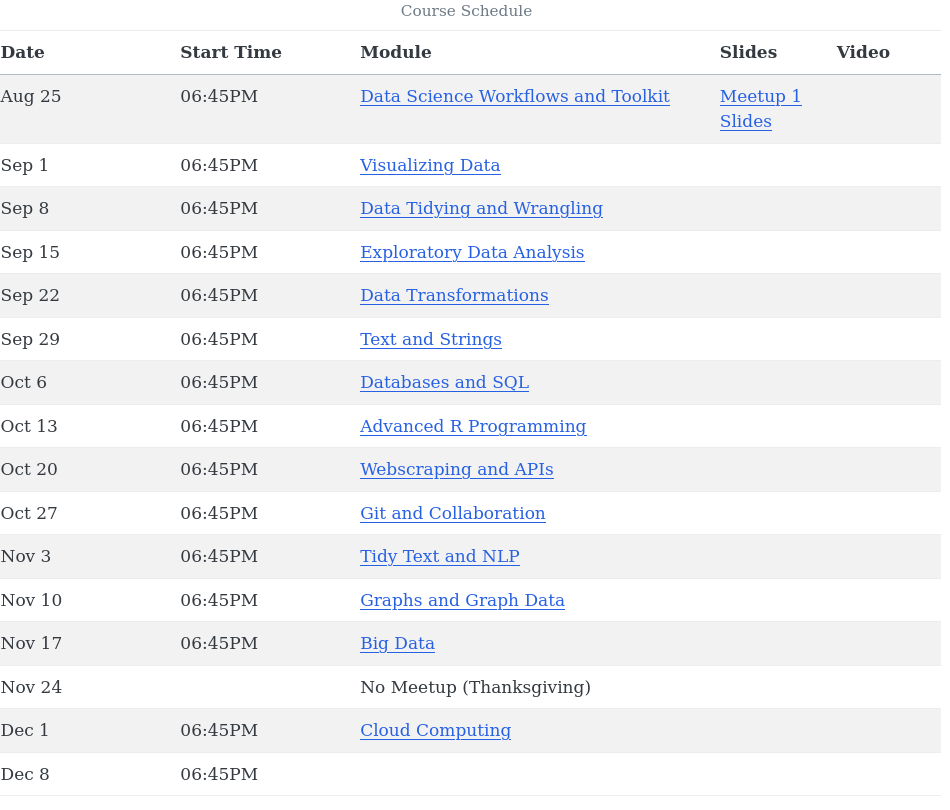
Schedule

Textbooks

  1. Hadley Wickham, Mine Çetinkaya-Rundel, and Garrett Grolemund. (2023). R for Data Science (2e). O’Reilly

  2. Jennifer Bryan. Happy Git and GitHub for the R User.

  3. Julia Silge and David Robinson (2017). Text Mining with R. O’Reilly

Recommended: Wickham, H. Advanced R. Baca Raton, FL: Taylor & Francis Group.

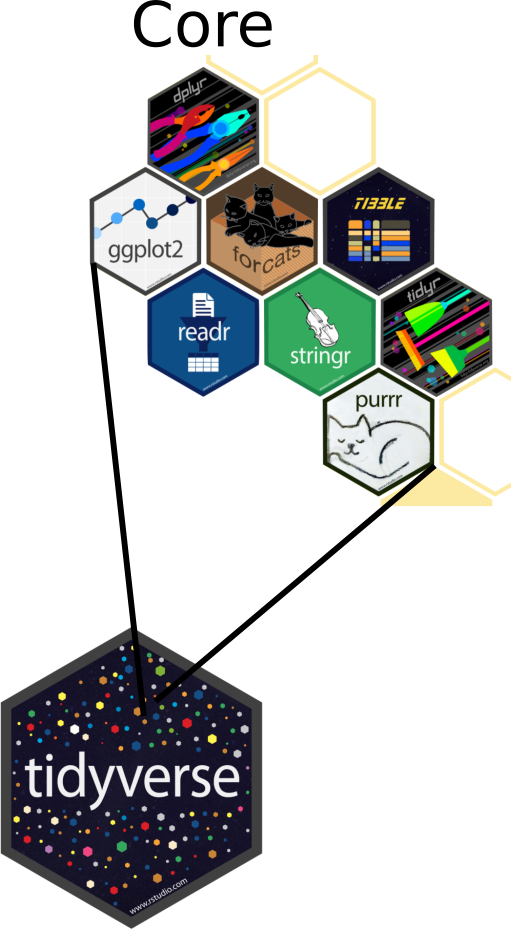
Tidyverse: Opinionated Ecosystem

  • Collection of compatible packages
  • Shared philosophy, common grammar
  • Strong Core, Many Extensions
  • Advantages and Disadvantages

What to do this week?

  1. Readings:
    • Intro and Chapter 28 of R4DS
    • Quarto Tutorial
    • Appendix on R Help Files
  2. Get software installed and configured:
  3. Write a post introducing yourself in the brightspace discussion board
  4. Sign up for your Data Science in Context Presentation

RStudio versus Positron

  • Until recently RStudio was the most common R IDE
  • Now community cautiously switching to Positron
  • Use Positron if:
    • You have used VS Code before/have programming experience
    • Want to future proof yourself
  • Use RStudio if:
    • You like it more than positron

Community Building/Networking

  • Be active in the slack!
    • Look at the social channel for events
    • Starting a “journal club”
  • Join our linkedin group

Community Building/Networking

Image References

  1. Coal: By Morgre - Own work, CC BY-SA 3.0
  2. Gas/Methane: By Georg Slickers - Self-photographed, CC BY-SA 3.0
  3. Hydro: By Source file: Le Grand PortageDerivative work: Rehman - File:Three_Gorges_Dam,_Yangtze_River,_China.jpg, CC BY 2.0
  4. Solar: By Parabel GmbH - Own work, CC BY-SA 3.0
  5. Wind: By Erik Wilde from Berkeley, CA, USA - harvesting wind, CC BY-SA 2.0