Meetup 14: Distributed Computing and Apache Spark

George I. Hagstrom

Why distributed computing?

Answer: For the same reason you wouldn’t have one person build the NYC subway

  • Many problems cannot be solved by a single processor/computer
    • Limited by processing power
    • Limited by memory
  • Enormous applications:
    • Invented for physical sciences
    • Big Data, AI, Machine Learning, etc etc

What is Distributed Computing

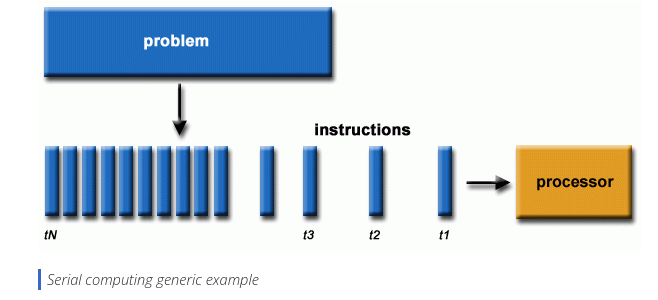
Serial computing: single task at a time: llnl-hpc

What is Distributed Computing

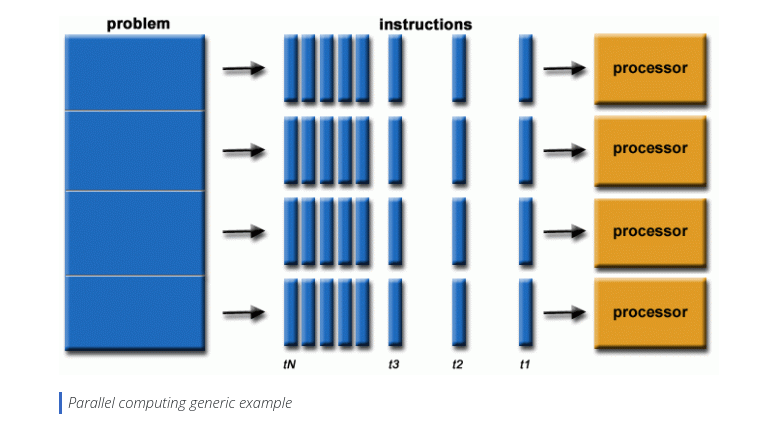
  • Parallel or distributed Computing: divide tasks among compute units:

llnl-hpc

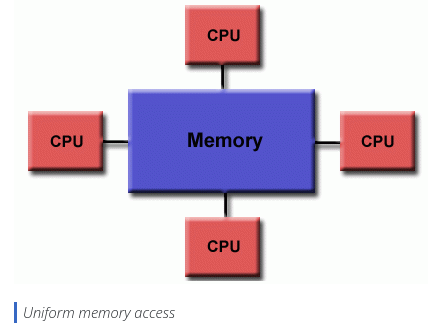
Distributed Computing Paradigms: Shared Memory

llnl-hpc

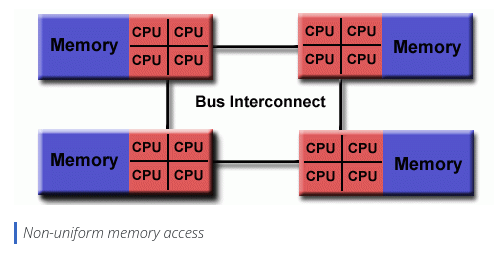
Distributed Computing Paradigms: Cluster

llnl-hpc

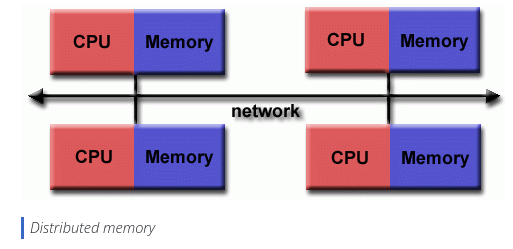
Distributed Computing Paradigms: Distributed

llnl-hpc

Apache Spark Architecture

  • Spark is a tool for high performance computing on a distributed cluster
  • “Secret Sauce” is something called an RDD or “Resilient Distributed Dataset”
  • Developed in 2009 and spun out of UC Berkeley
  • Requires two external resources:
    • Distributed file system (disk)
    • Cluster manager (cloud)

Pros of Spark

  • Extremely fast
  • Complexity under the hood
  • Very scalable
  • Robust/fault tolerant
  • Good library support for machine learning, graphs, and databases
  • Great for streaming analysis

Cons of Spark

  • Memory requirements $$$
  • Can require programming chops as you get more into it

sparklyr

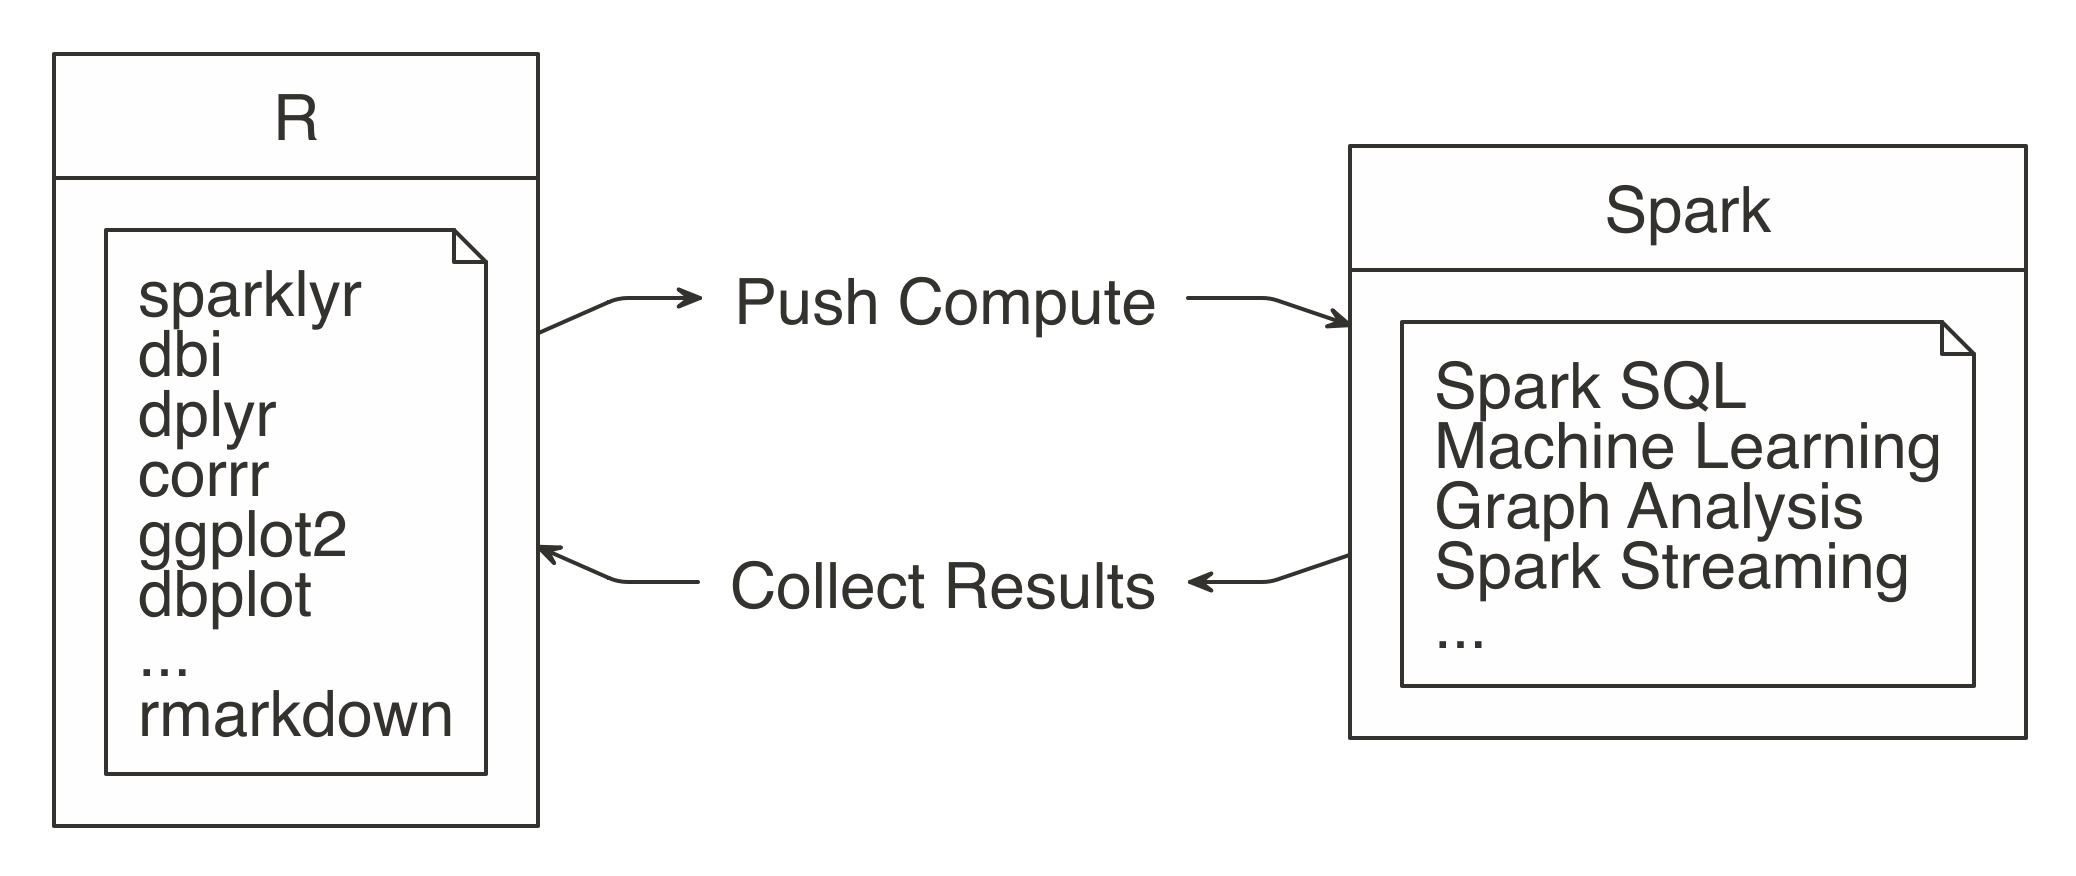
  • You can do data analysis in spark using almost the same syntax as dplyr
  • Computational process is different- workflow creates a series of instructions, gets executed all at once
  • Only certain key results returned to R by collect

Mastering Spark with R

Creating a Spark instance

  • Normally you run spark on a cluster or a data center
  • Can generate a “local” spark instance to practice
library(sparklyr)
library(tidyverse)

spark_instance <- spark_connect(master = "local", version = "3.3",config = list("sparklyr.shell.driver-memory" = "8g"))

spark_instance
$master
[1] "local"

$method
[1] "shell"

$app_name
[1] "sparklyr"

$config
$config$`sparklyr.shell.driver-memory`
[1] "8g"

$config$sparklyr.shell.name
[1] "sparklyr"


$state
<environment: 0x5b287be0d258>

$extensions
$extensions$jars
character(0)

$extensions$packages
character(0)

$extensions$initializers
list()

$extensions$catalog_jars
character(0)

$extensions$repositories
character(0)

$extensions$dbplyr_sql_variant
$extensions$dbplyr_sql_variant$scalar
list()

$extensions$dbplyr_sql_variant$aggregate
list()

$extensions$dbplyr_sql_variant$window
list()


$spark_home
[1] "/home/georgehagstrom/spark/spark-3.3.4-bin-hadoop3"

$backend
A connection with                              
description "->localhost:8881"
class       "sockconn"        
mode        "wb"              
text        "binary"          
opened      "opened"          
can read    "yes"             
can write   "yes"             

$monitoring
A connection with                              
description "->localhost:8881"
class       "sockconn"        
mode        "wb"              
text        "binary"          
opened      "opened"          
can read    "yes"             
can write   "yes"             

$gateway
A connection with                              
description "->localhost:8880"
class       "sockconn"        
mode        "rb"              
text        "binary"          
opened      "opened"          
can read    "yes"             
can write   "yes"             

$output_file
[1] "/tmp/Rtmp1in5GI/fileb336a3a05ec9_spark.log"

$sessionId
[1] 57263

$home_version
[1] "3.3"

attr(,"class")
[1] "spark_connection"       "spark_shell_connection" "DBIConnection"         

Getting data into spark

  • Small datasets for practice: copy_to
spark_cars = spark_instance |> copy_to(mtcars)

spark_cars
# Source:   table<`mtcars`> [?? x 11]
# Database: spark_connection
     mpg   cyl  disp    hp  drat    wt  qsec    vs    am  gear  carb
   <dbl> <dbl> <dbl> <dbl> <dbl> <dbl> <dbl> <dbl> <dbl> <dbl> <dbl>
 1  21       6  160    110  3.9   2.62  16.5     0     1     4     4
 2  21       6  160    110  3.9   2.88  17.0     0     1     4     4
 3  22.8     4  108     93  3.85  2.32  18.6     1     1     4     1
 4  21.4     6  258    110  3.08  3.22  19.4     1     0     3     1
 5  18.7     8  360    175  3.15  3.44  17.0     0     0     3     2
 6  18.1     6  225    105  2.76  3.46  20.2     1     0     3     1
 7  14.3     8  360    245  3.21  3.57  15.8     0     0     3     4
 8  24.4     4  147.    62  3.69  3.19  20       1     0     4     2
 9  22.8     4  141.    95  3.92  3.15  22.9     1     0     4     2
10  19.2     6  168.   123  3.92  3.44  18.3     1     0     4     4
# ℹ more rows

Getting data into spark

  • Also possible to read files from a regular disk
  • Distributes data across the cluster
taxi_spark = spark_read_parquet(spark_instance,"/home/georgehagstrom/work/Teaching/DATA607Fall2025/data/nyc_taxi_2024/", memory = TRUE)

taxi_spark
# Source:   table<`nyc_taxi_2024_d43caf28_9287_40e5_a087_c6b7bf9d304d`> [?? x 19]
# Database: spark_connection
   VendorID tpep_pickup_datetime tpep_dropoff_datetime passenger_count
      <int> <dttm>               <dttm>                          <dbl>
 1        2 2024-09-30 20:30:44  2024-09-30 20:48:26                 1
 2        1 2024-09-30 20:12:20  2024-09-30 20:25:25                 1
 3        1 2024-09-30 20:04:46  2024-09-30 20:13:52                 1
 4        1 2024-09-30 20:12:10  2024-09-30 20:23:01                 1
 5        1 2024-09-30 20:30:22  2024-09-30 20:30:39                 1
 6        2 2024-09-30 20:31:20  2024-09-30 20:36:00                 2
 7        1 2024-09-30 20:42:57  2024-09-30 20:49:01                 1
 8        1 2024-09-30 20:59:55  2024-09-30 21:02:24                 1
 9        1 2024-09-30 20:00:47  2024-09-30 20:04:22                 0
10        1 2024-09-30 20:17:36  2024-09-30 20:26:22                 1
# ℹ more rows
# ℹ 15 more variables: trip_distance <dbl>, RatecodeID <dbl>,
#   store_and_fwd_flag <chr>, PULocationID <int>, DOLocationID <int>,
#   payment_type <dbl>, fare_amount <dbl>, extra <dbl>, mta_tax <dbl>,
#   tip_amount <dbl>, tolls_amount <dbl>, improvement_surcharge <dbl>,
#   total_amount <dbl>, congestion_surcharge <dbl>, Airport_fee <dbl>
Transformations and Actions

  • Two types main types of functions in sparklyr/spark
  • Transformations create a logical string of operations
    • filter, select, join, map, mutate, …
  • Actions execute the transformations and can return results to R
    • collect, compute

Example

  • Transformations use “lazy evaluation”

taxi_v2 = taxi_spark |> 
  filter(VendorID == 2) |>  group_by(passenger_count) |> 
  summarise( num_trips = n(),
    mean_distance =  mean(trip_distance,na.rm = TRUE),
    mean_fare = mean(fare_amount,na.rm = TRUE),
    mean_tip = mean(tip_amount,na.rm = TRUE))

taxi_v2
# Source:   SQL [?? x 5]
# Database: spark_connection
   passenger_count num_trips mean_distance mean_fare mean_tip
             <dbl>     <dbl>         <dbl>     <dbl>    <dbl>
 1               0      1380         0.546      26.9    3.72 
 2               7        54         3.95       55.7    9.75 
 3              NA   3224609        22.6        20.0    0.708
 4               6    207723         3.10       18.3    3.50 
 5               9        32         4.63       83.7    7.52 
 6               5    312525         3.34       19.0    3.62 
 7               1  21629495         3.29       18.5    3.61 
 8               3   1041428         4.01       21.8    3.81 
 9               8       190         2.84       77.0   11.3  
10               2   4350662         4.23       22.2    4.06 
# ℹ more rows

Actions complete the computation

taxi_v2 |> collect()
# A tibble: 11 × 5
   passenger_count num_trips mean_distance mean_fare mean_tip
             <dbl>     <dbl>         <dbl>     <dbl>    <dbl>
 1               0      1380         0.546      26.9    3.72 
 2               7        54         3.95       55.7    9.75 
 3              NA   3224609        22.6        20.0    0.708
 4               6    207723         3.10       18.3    3.50 
 5               9        32         4.63       83.7    7.52 
 6               5    312525         3.34       19.0    3.62 
 7               1  21629495         3.29       18.5    3.61 
 8               3   1041428         4.01       21.8    3.81 
 9               8       190         2.84       77.0   11.3  
10               2   4350662         4.23       22.2    4.06 
11               4    683405         4.21       24.2    3.85 
  • Use collect() to execute your analysis and bring the results to R for visualization etc

Caching

  • Common workflow involves splitting into two steps:
    • Data wrangling/transformations
    • Statistical modeling
  • It can be most efficient to cache outcome of transformations
  • Use compute to create an intermediate dataset in spark
cached_taxi = taxi_v2 |> compute()