Meetup 3: Tidy Data

George Hagstrom

2025-09-08

Questions from last week

Event!

  • We are having a department wide, online event tomorrow at 7PM!
  • Meet and chat with the program director, your professors, and other students
  • https://us02web.zoom.us/j/2994528670?omn=85792887090

What to do this Week

Read:

What to do this Week

Homework:

Helpful tutorial:

What to do this Week

Watch (alternative to my lectures):

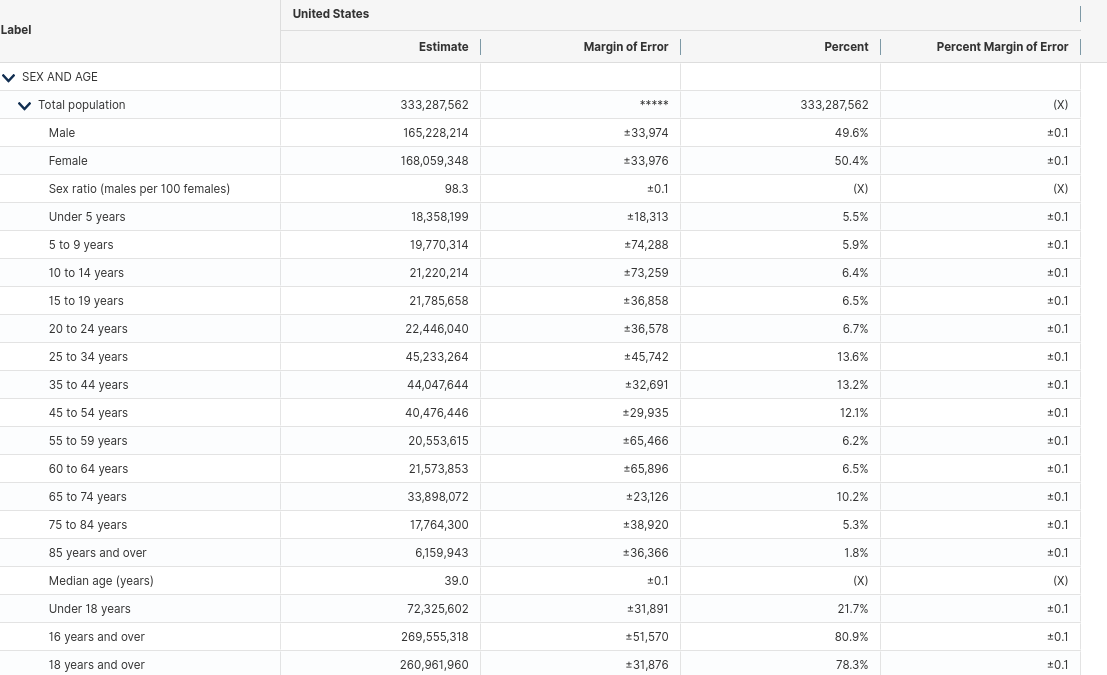
Unstructured Data

Need to reinvent wheel every time to analyze:
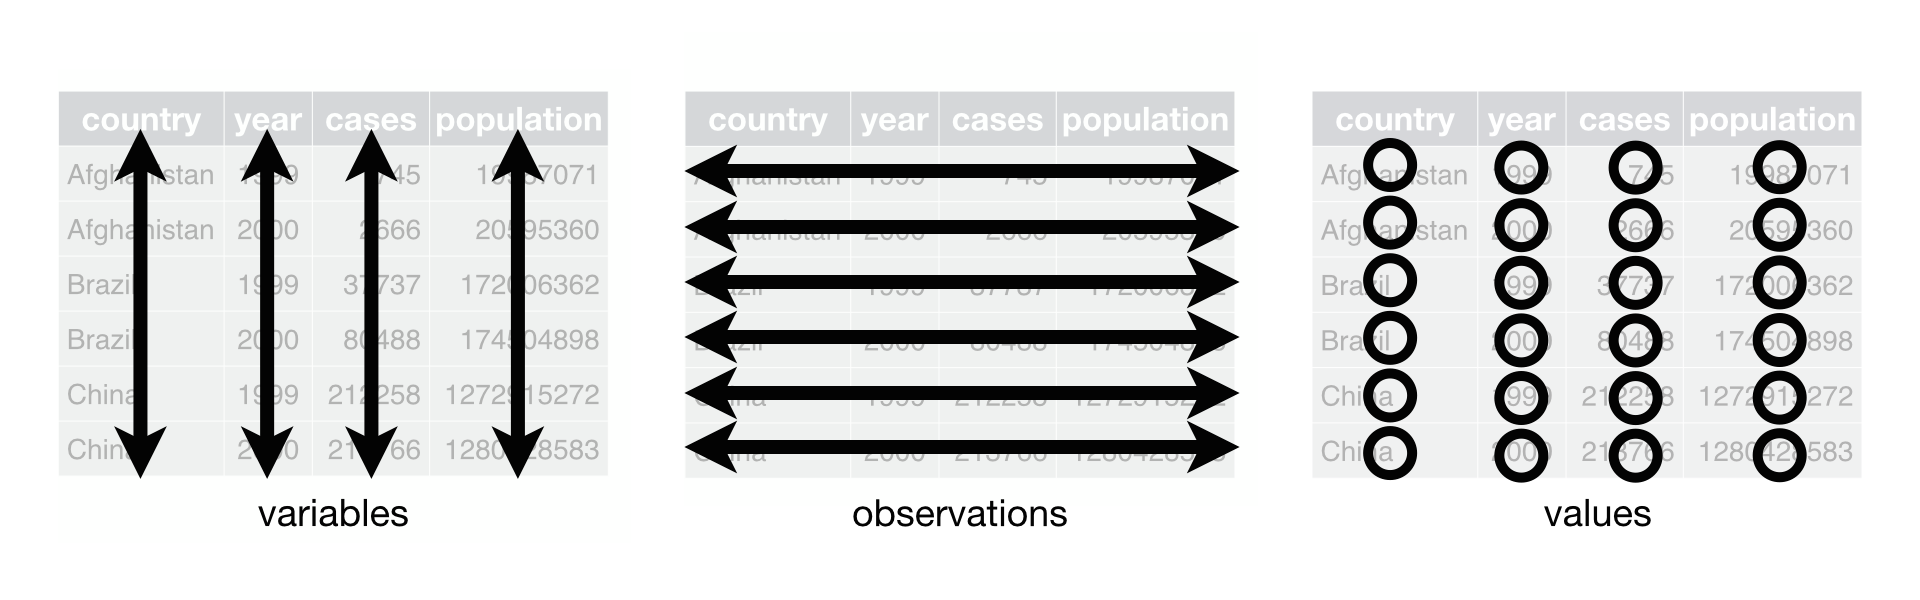
Tidy Data (Rebranded Data Matrix?)

  1. Columns are variables
  2. Rows are observations
  3. One value per cell

Fig 5.1 from R4DS

Example

Untidy:

# A tibble: 5 × 58
  country   year new_sp_m014 new_sp_m1524 new_sp_m2534 new_sp_m3544 new_sp_m4554
  <chr>    <dbl>       <dbl>        <dbl>        <dbl>        <dbl>        <dbl>
1 Afghani…  2001         129          379          349          274          204
2 Afghani…  2002          90          476          481          368          246
3 Afghani…  2003         127          511          436          284          256
4 Afghani…  2004         139          537          568          360          358
5 Afghani…  2005         151          606          560          472          453
# ℹ 51 more variables: new_sp_m5564 <dbl>, new_sp_m65 <dbl>, new_sp_f014 <dbl>,
#   new_sp_f1524 <dbl>, new_sp_f2534 <dbl>, new_sp_f3544 <dbl>,
#   new_sp_f4554 <dbl>, new_sp_f5564 <dbl>, new_sp_f65 <dbl>,
#   new_sn_m014 <dbl>, new_sn_m1524 <dbl>, new_sn_m2534 <dbl>,
#   new_sn_m3544 <dbl>, new_sn_m4554 <dbl>, new_sn_m5564 <dbl>,
#   new_sn_m65 <dbl>, new_sn_f014 <dbl>, new_sn_f1524 <dbl>,
#   new_sn_f2534 <dbl>, new_sn_f3544 <dbl>, new_sn_f4554 <dbl>, …

Tidy:

# A tibble: 7 × 6
  country      year diagnosis gender age   count
  <chr>       <dbl> <chr>     <chr>  <chr> <dbl>
1 Afghanistan  2001 sp        m      014     129
2 Afghanistan  2001 sp        m      1524    379
3 Afghanistan  2001 sp        m      2534    349
4 Afghanistan  2001 sp        m      3544    274
5 Afghanistan  2001 sp        m      4554    204
6 Afghanistan  2001 sp        m      5564    139
7 Afghanistan  2001 sp        m      65      103

Why Does the TidyVerse Work?

Tidyverse functions:

  • Take tidy data as input
  • Return tidy data as output
  • Can freely chain together functions
tidyDataset |> 
  filter(...) |> 
  mutate(...) |> 
  select(...) |> 
  group_by(...) |> 
  summarise(...) |> 
  ggplot(aes(...)) +
  ...

Tidyverse is successful because it insists on the tidy format and because it is designed around it. Other ecosystems (base R, pandas, etc) don’t always return tidy output from tidy input.

Originated from Relational Databases

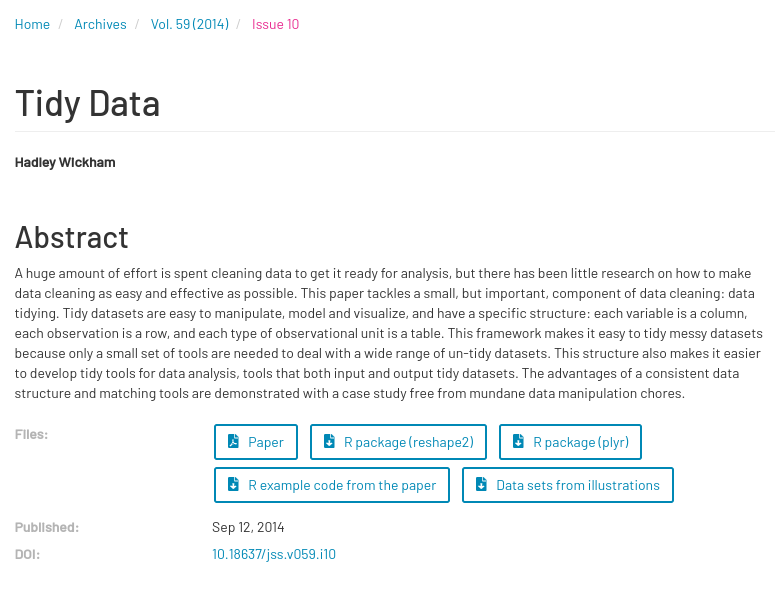
Original Tidy Data Def:

  1. Columns are variables
  2. Rows are observations
  3. One observational unit per table

Original Tidy Data Paper

If you have studied relational databases you might recognize Codd’s 3rd normal form.

New Versus Old Tidy
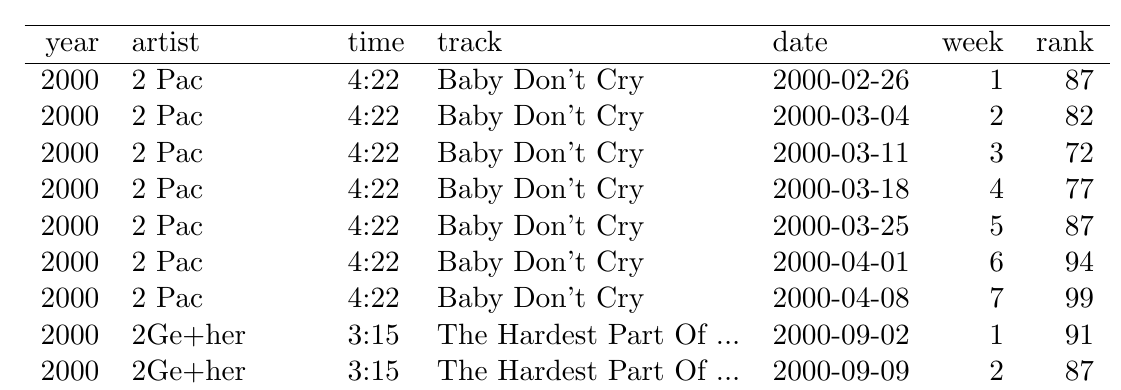
Fig 8 of Tidy Data Paper New Tidy- repeats a lot of data on songs but easier to analyze because of flat structure

New Versus Old Tidy
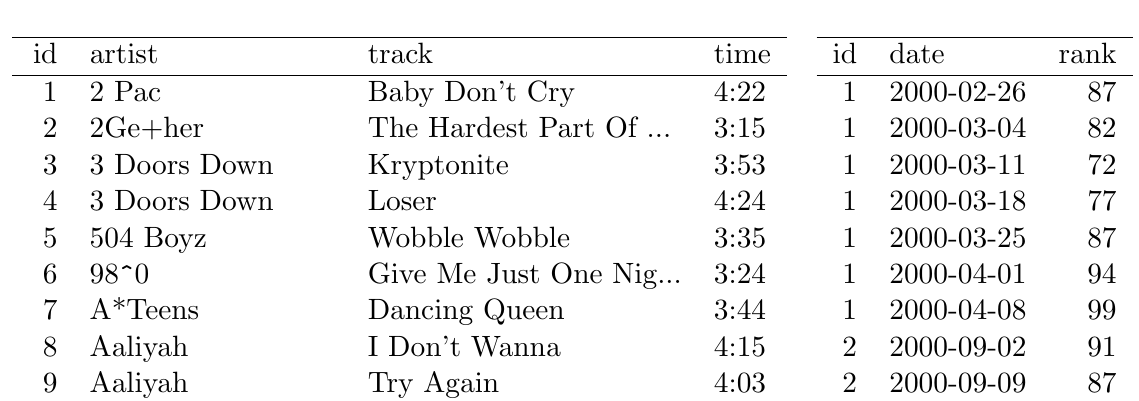
Fig 13 of Tidy Data Paper Old tidy: Space efficient like a database

Wide Data

  • All data corresponding to a single observational unit in a single row
  • Values of First Column unique
  • Easy to process visually
  • Some software works better with wide data
track wk1 wk2 wk3 wk4 wk5 wk6 wk7 wk8 wk9 wk10
Baby Don’t Cry (Keep… 87 82 72 77 87 94 99 NA NA NA
The Hardest Part Of … 91 87 92 NA NA NA NA NA NA NA
Kryptonite 81 70 68 67 66 57 54 53 51 51
Loser 76 76 72 69 67 65 55 59 62 61
Wobble Wobble 57 34 25 17 17 31 36 49 53 57

Tall Data

  • First column values repeat
  • Works well with software like R
  • Harder to process visually
  • Tidy data typically Tall
track Week Rank
Baby Don’t Cry (Keep… 1 87
Baby Don’t Cry (Keep… 2 82
Baby Don’t Cry (Keep… 3 72
Baby Don’t Cry (Keep… 4 77
Baby Don’t Cry (Keep… 5 87
Baby Don’t Cry (Keep… 6 94
Baby Don’t Cry (Keep… 7 99
The Hardest Part Of … 1 91

Tall and wide can contain the same info, distinction between them is not always completely precise.

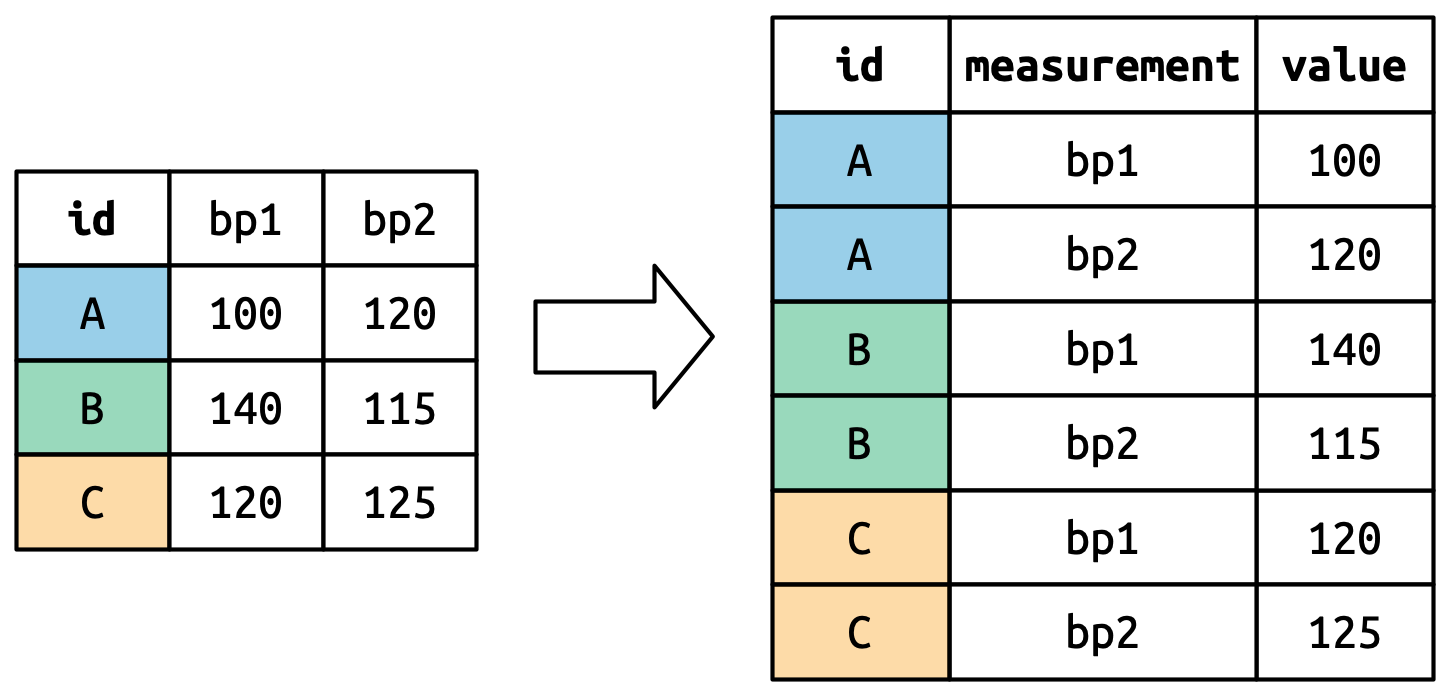
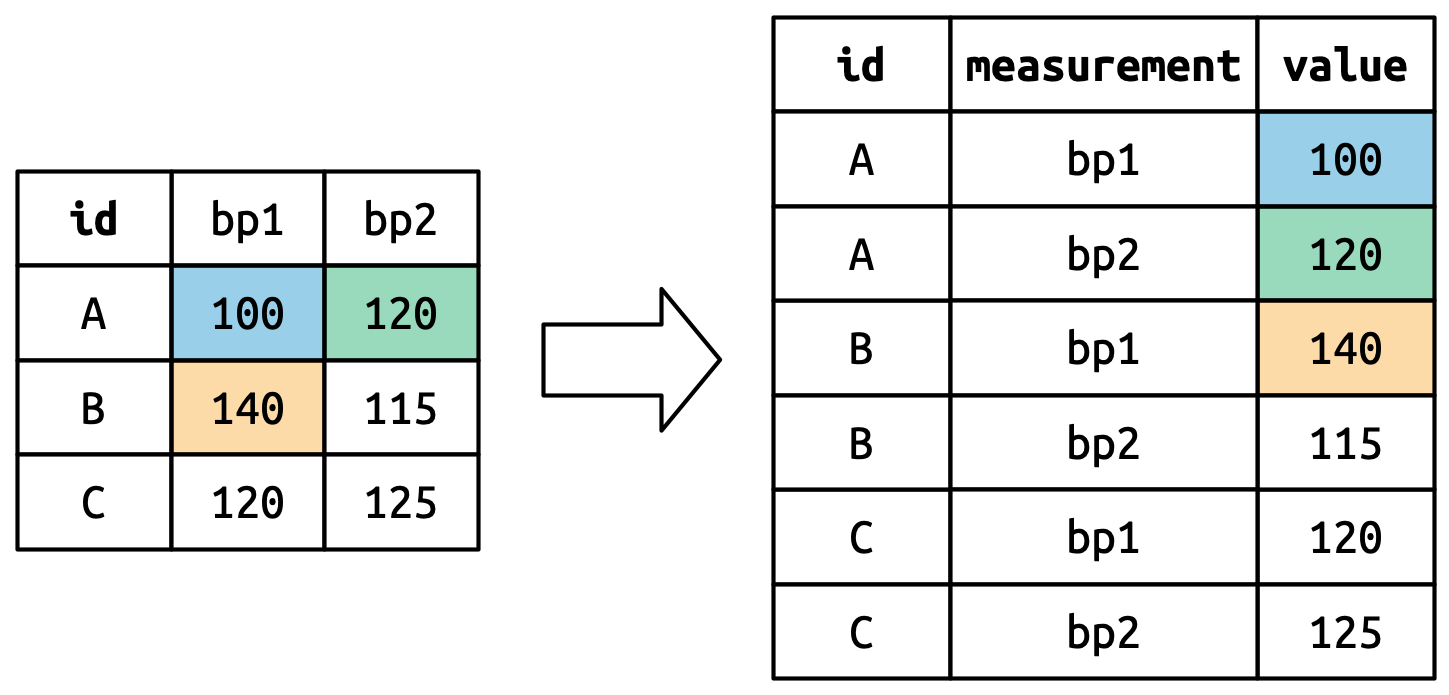
Pivot Longer

id bp1 bp2
A 100 120
B 140 115
C 120 125
id measurement value
A bp1 100
A bp2 120
B bp1 140
B bp2 115
C bp1 120
C bp2 125

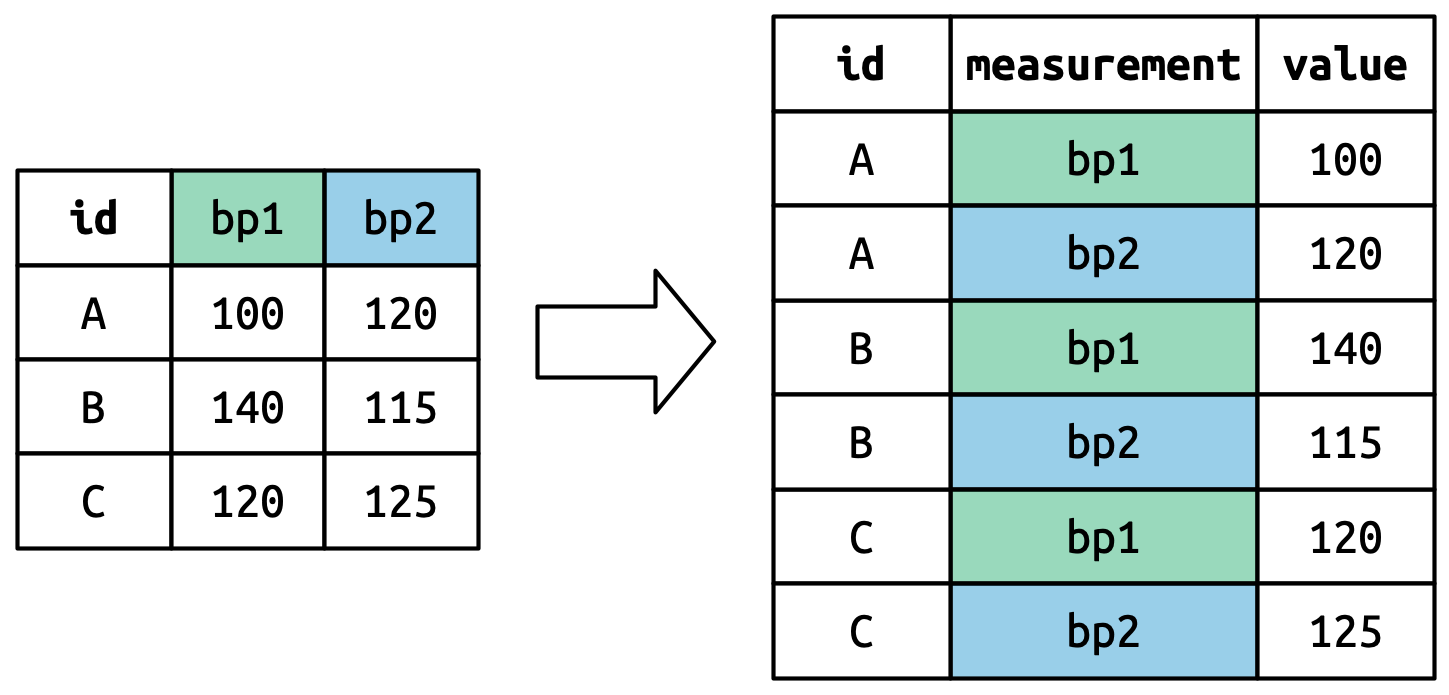
Pivot Longer

df_long = df |> pivot_longer(
                   cols = bp1:bp2,
                   names_to = "measurement",
                   values_to = "value"
                   )
# A tibble: 6 × 3
  id    measurement value
  <chr> <chr>       <dbl>
1 A     bp1           100
2 A     bp2           120
3 B     bp1           140
4 B     bp2           115
5 C     bp1           120
6 C     bp2           125

Pivot Longer

df_long = df |> pivot_longer(
                   cols = bp1:bp2,
                   names_to = "measurement",
                   values_to = "value"
                   )

R4DS 5.3

Pivot Longer

df_long = df |> pivot_longer(
                   cols = bp1:bp2,
                   names_to = "measurement",
                   values_to = "value"
                   )

R4DS 5.4

Pivot Longer

df_long = df |> pivot_longer(
                   cols = bp1:bp2,
                   names_to = "measurement",
                   values_to = "value"
                   )

R4DS 5.5

Pivot Wider

  • Select column for names and column for values
  • Distinct values in column become new column headers
  • Values get mapped from other column
  • Potential for NA values…..
id measurement value
A bp1 100
A bp1 102
B bp2 120
B bp2 140
A bp3 115

Pivot Wider

id meas val
A bp1 100
B bp1 102
B bp2 120
A bp2 140
A bp3 115
id bp1 bp2 bp3
A 100 140 115
B 102 120 NA
df |> pivot_wider(
  names_from = meas,
  values_from = val
) 

Pivot Wider: Non-unique values

id meas val
A bp1 100
B bp1 102
B bp2 120
A bp2 140
A bp2 115
id bp1 bp2
A 100 140, 115
B 102 120
df |> pivot_wider(
  names_from = meas,
  values_from = val
) 

Pivot Wider: Multiple Rows

id meas val time
A bp1 100 day
B bp1 102 night
B bp2 120 night
A bp2 140 day
A bp3 115 morning
id time bp1 bp2 bp3
A day 100 140 NA
B night 102 120 NA
A morning NA NA 115

When to use each pivot

  • pivot_longer tidies data where variables and/or data are in the column names
country year sp_m_014 sp_m_1524 sp_m_2534 sp_m_3544 sp_m_4554
Afghanistan 1980 NA NA NA NA NA
Afghanistan 1981 NA NA NA NA NA
Afghanistan 1982 NA NA NA NA NA
Afghanistan 1983 NA NA NA NA NA
Afghanistan 1984 NA NA NA NA NA

When to use each pivot

  • pivot_wider tidies data where measurements are spread across multiple rows
station date measure value
1 2024/09/01 temp 25.0 C
1 2024/09/01 pressure 700mmHg
1 2024/09/01 humidity 60%
1 2024/09/01 rain .2in
1 2024/09/02 temp 22.0 C
1 2024/09/02 pressure 800mmHg
1 2024/09/02 humidity 40%

Tidy Data Defined Based on Your Goals

  • “variable” and “measurement” is partially up to you!
  • Pick the definitions that are best suited for you analysis

Weather Station Vignette

Follow along:

Data Science in Context Presentation

Meetup Reflection/One Minute Paper

Please fill out the following google form after the meeting or watching the video:

Click Here