Meetup 1: Developing a Critical Eye
Events Upcoming
- Once per month (Tuesday, Wedneday, Thursday) “field trips” to New York Open Statistical Computing Meetup
- nyhackr.org
![]()
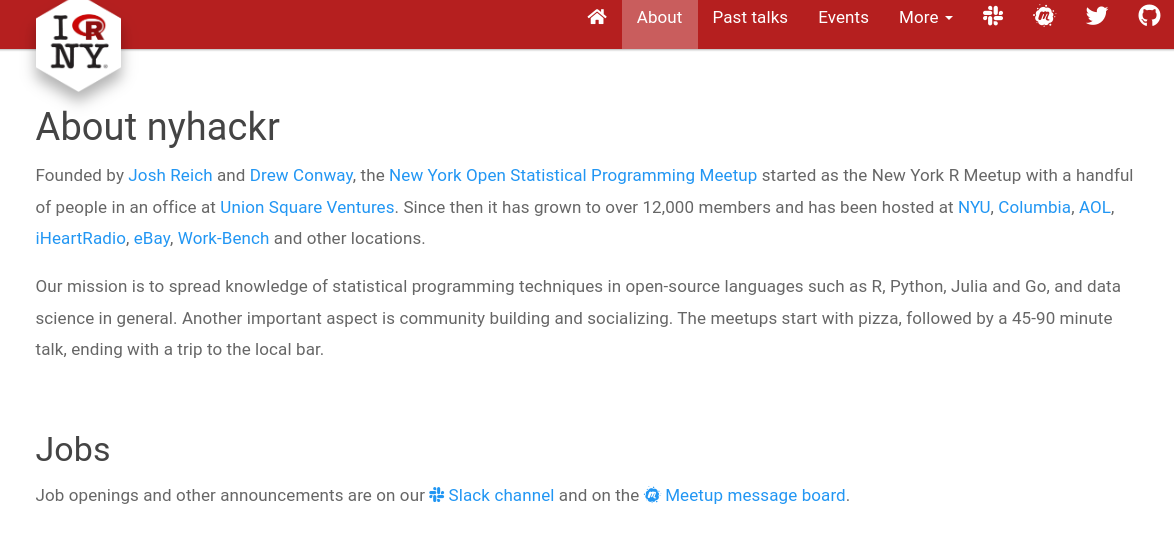
Events Upcoming!
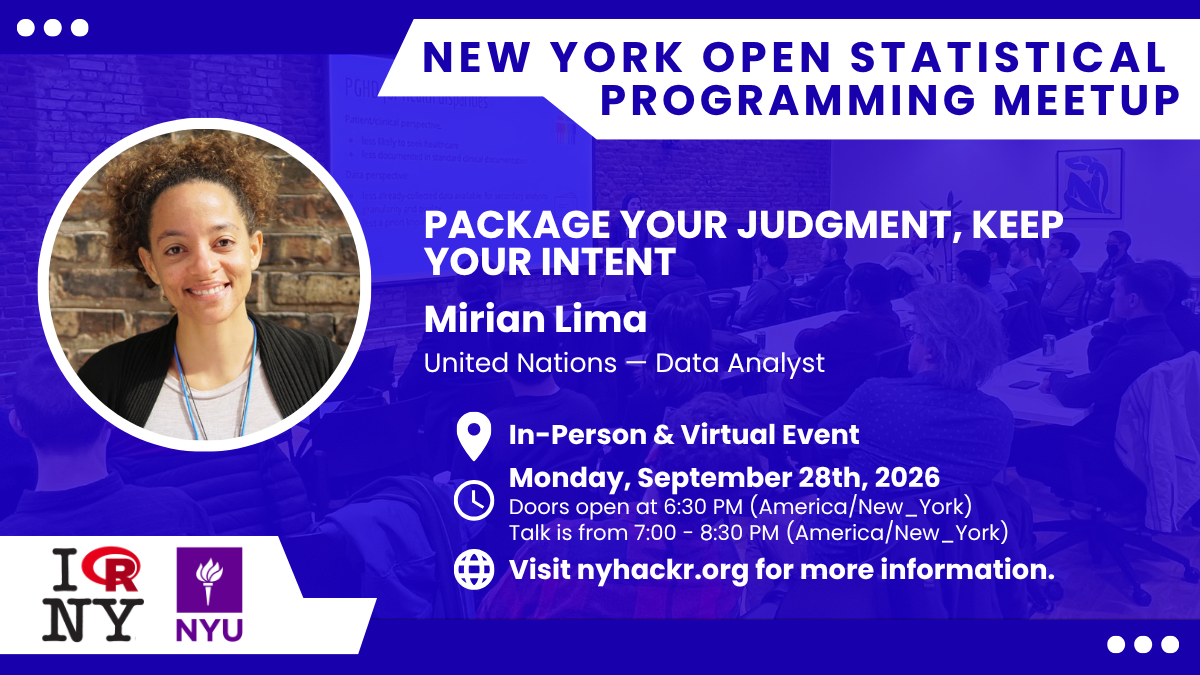
nyhackr.org
Events Upcoming!
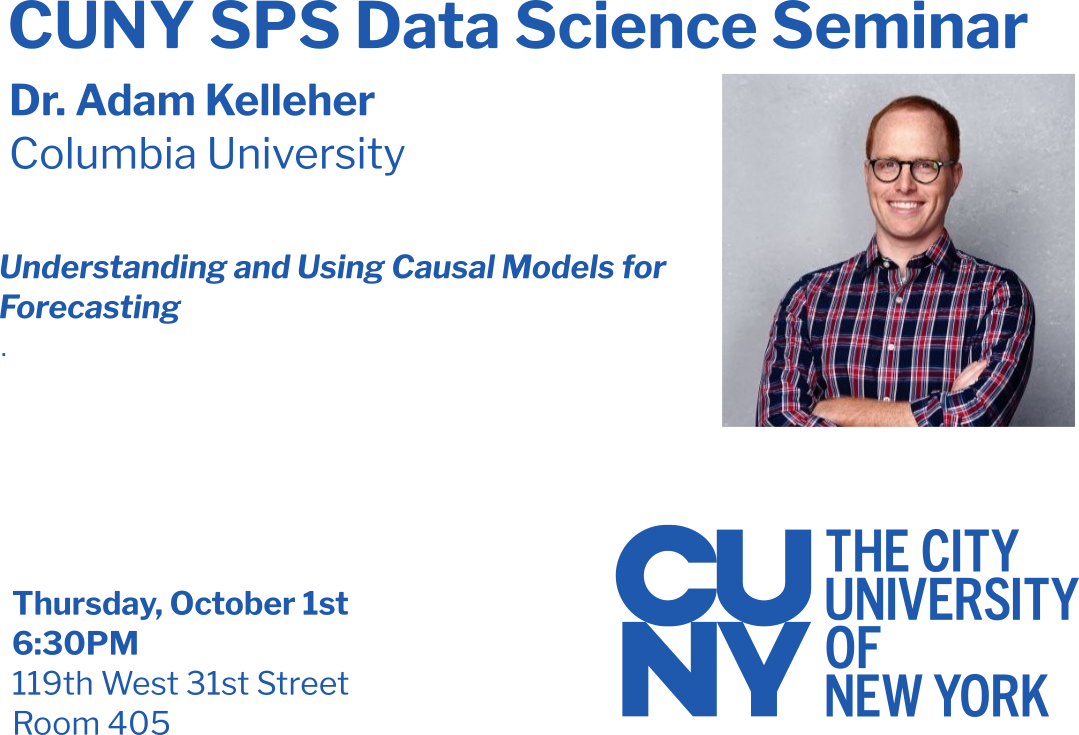
nyhackr.org
Why do we need a class on this?
- People are not naturally good at telling stories using data
![]()
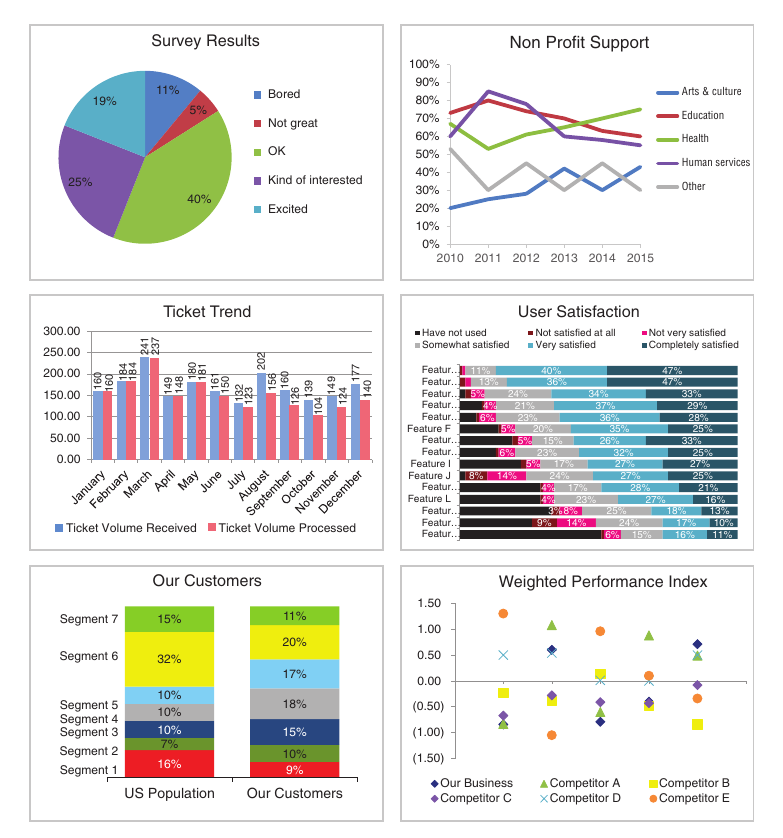
Why do we need a class on this?
- The world is full of awful visualizations
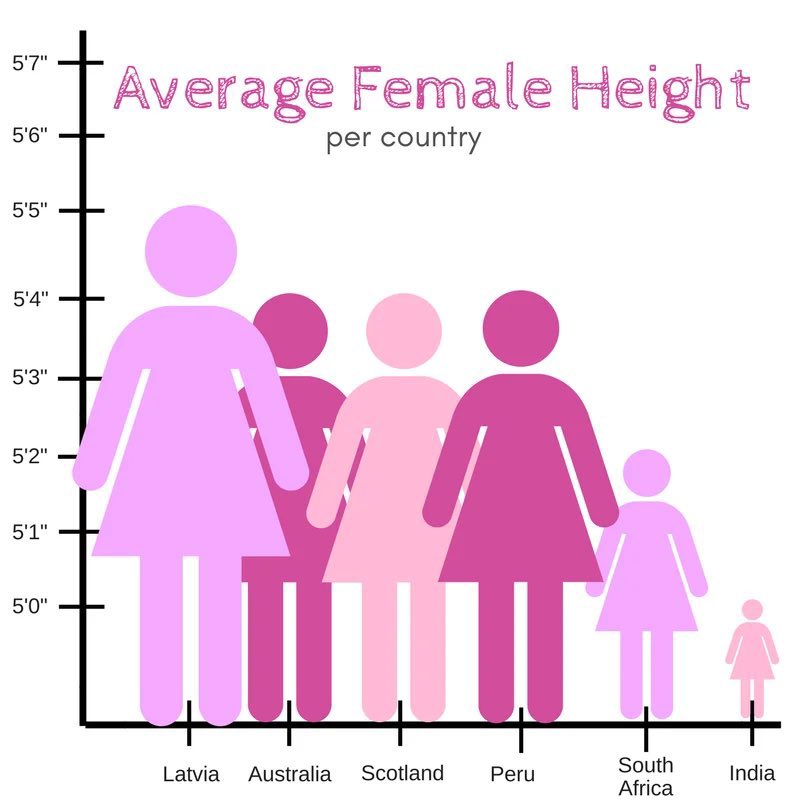
Why do we need a class on this?
- The world is full of awful visualizations
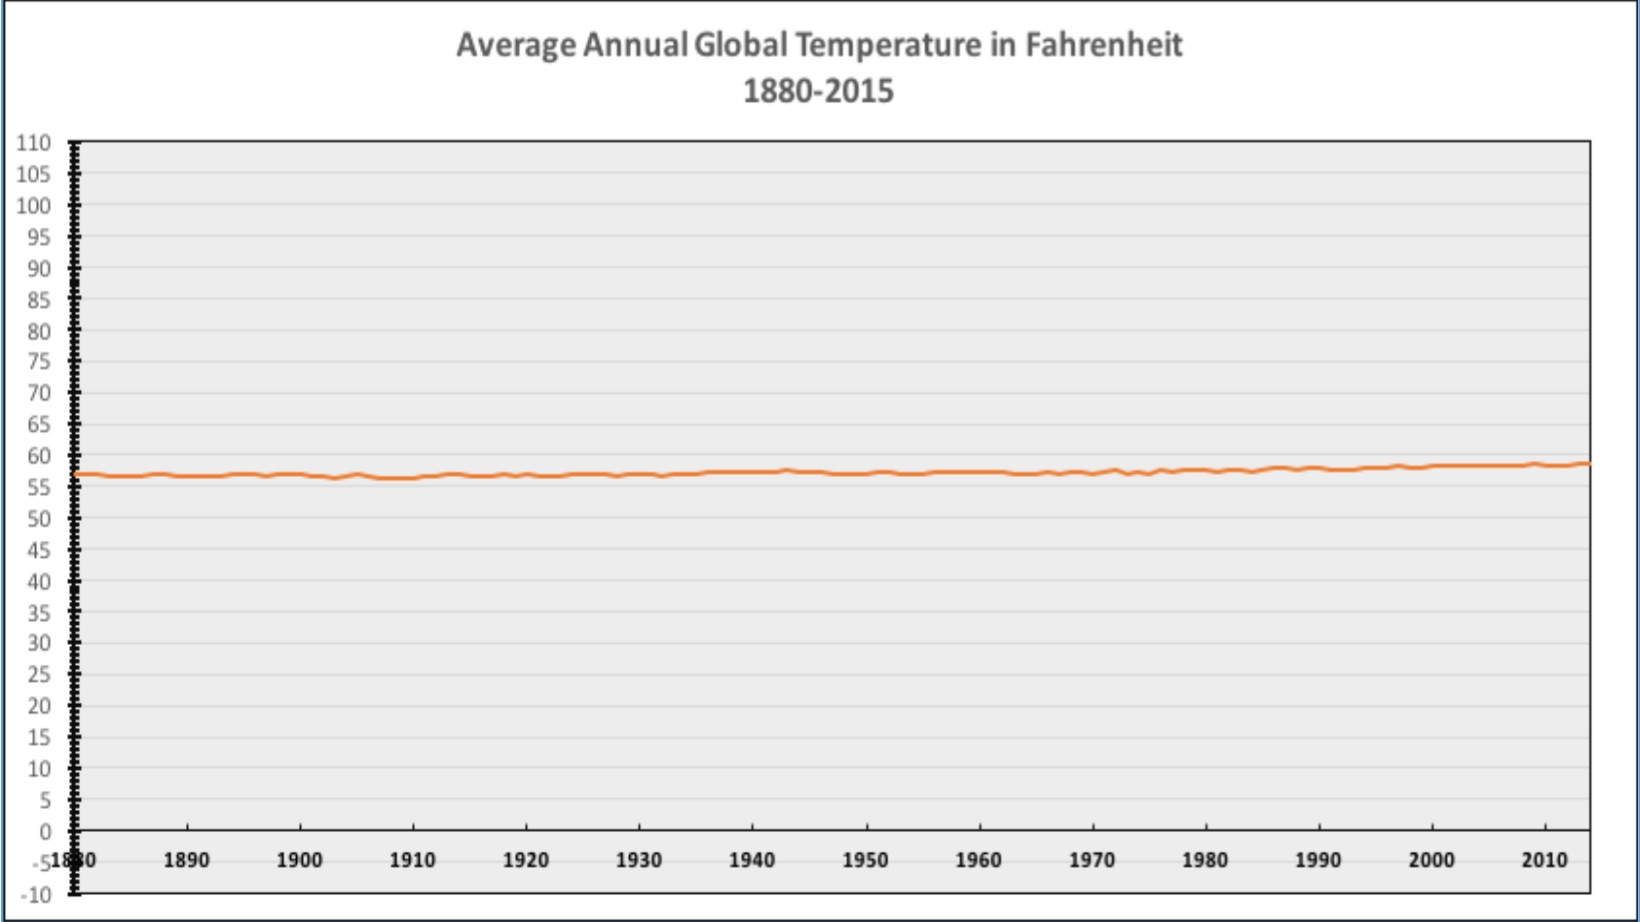
Why do we need a class on this?
- The world is full of awful visualizations
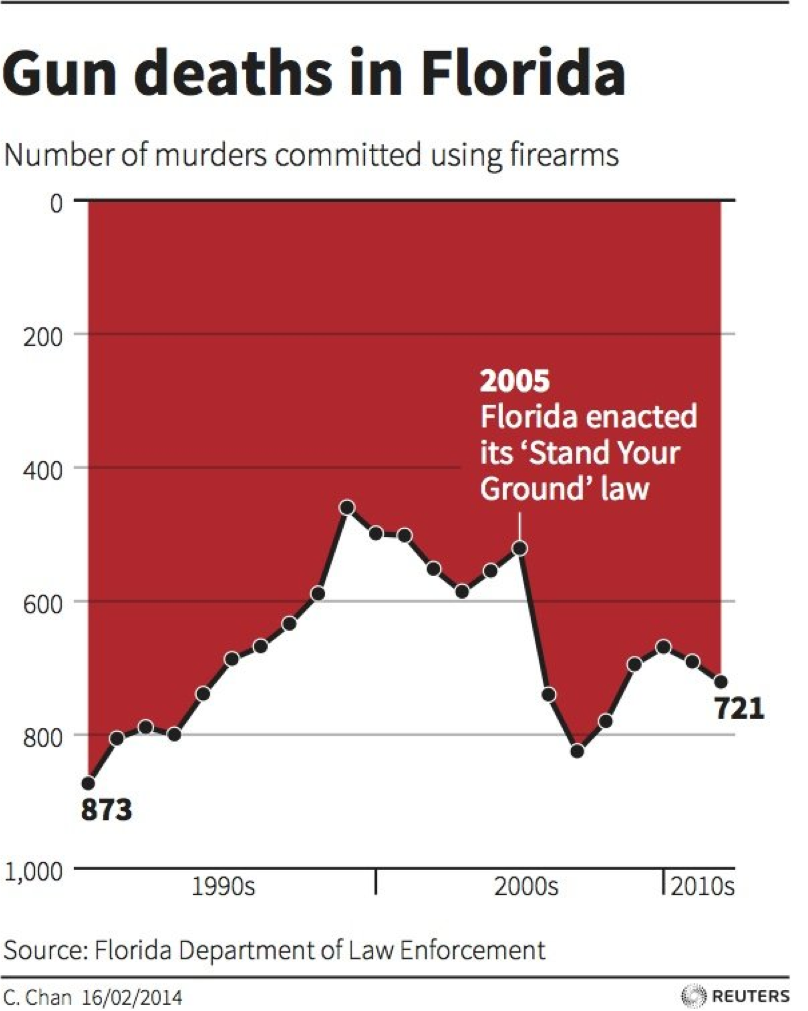
Why do we need a class on this?
- The world is full of awful visualizations
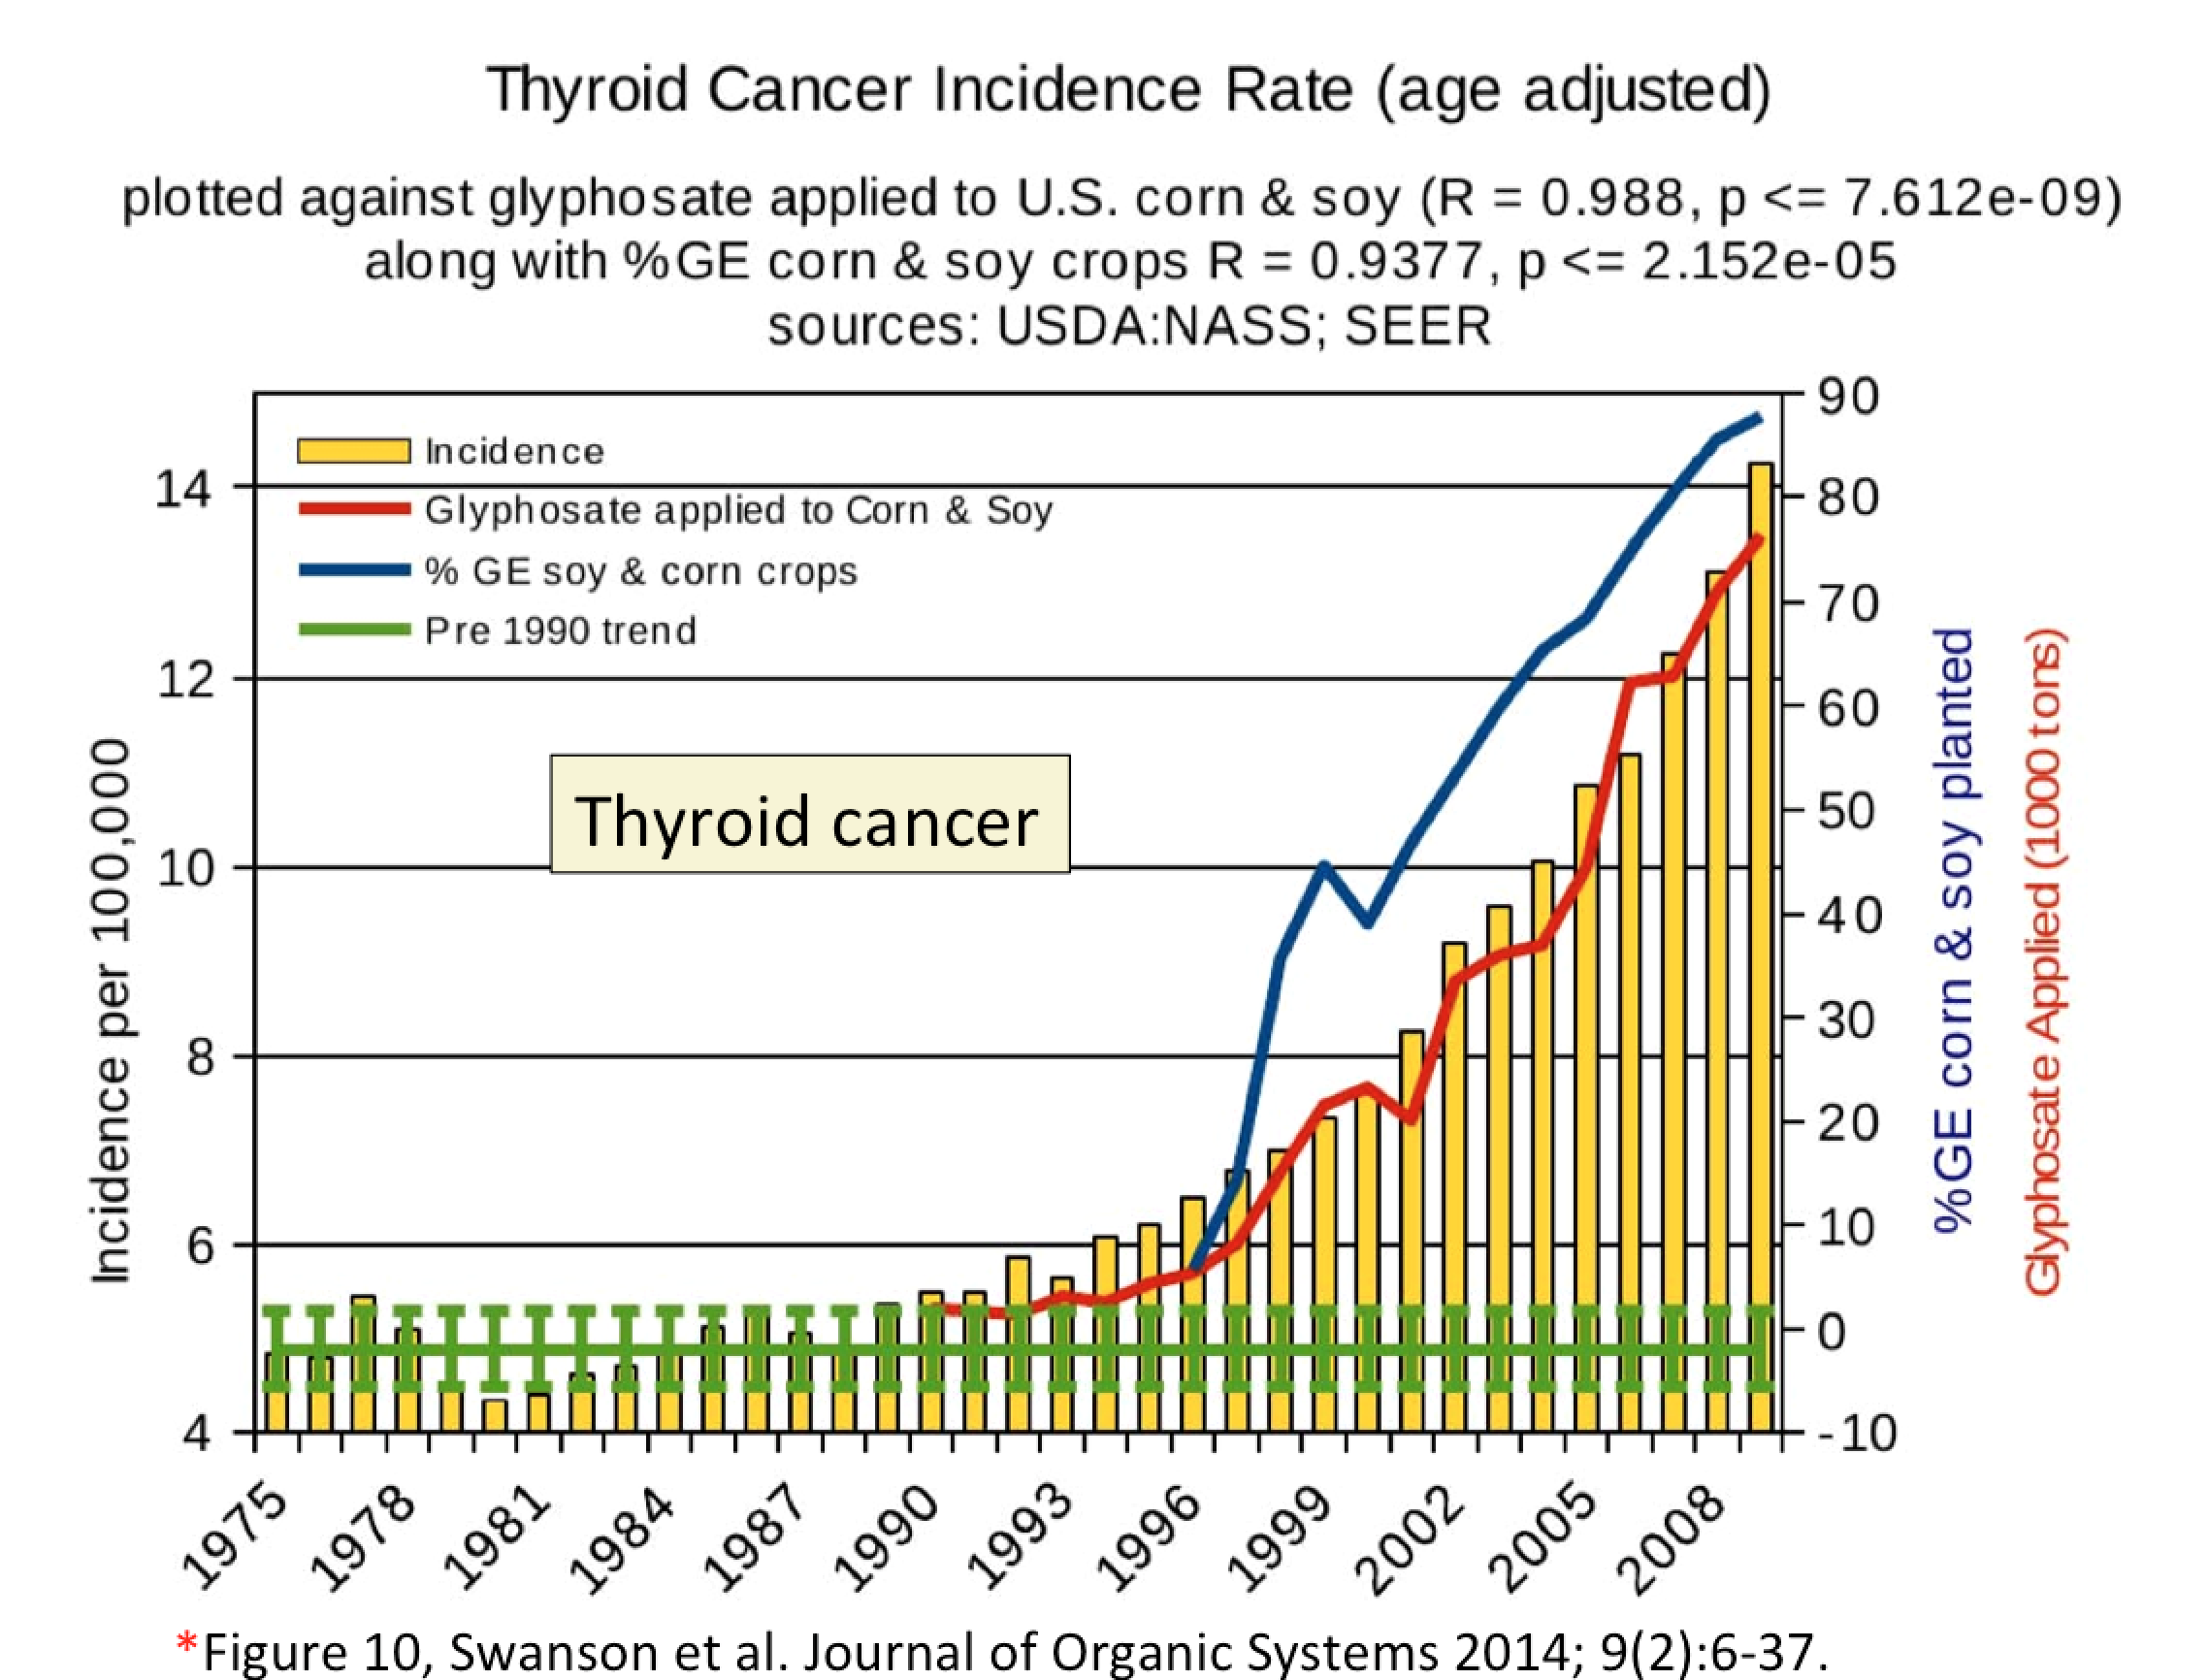
Case Study
- Your firm had two employees leave in May
- This caused a backlog of work
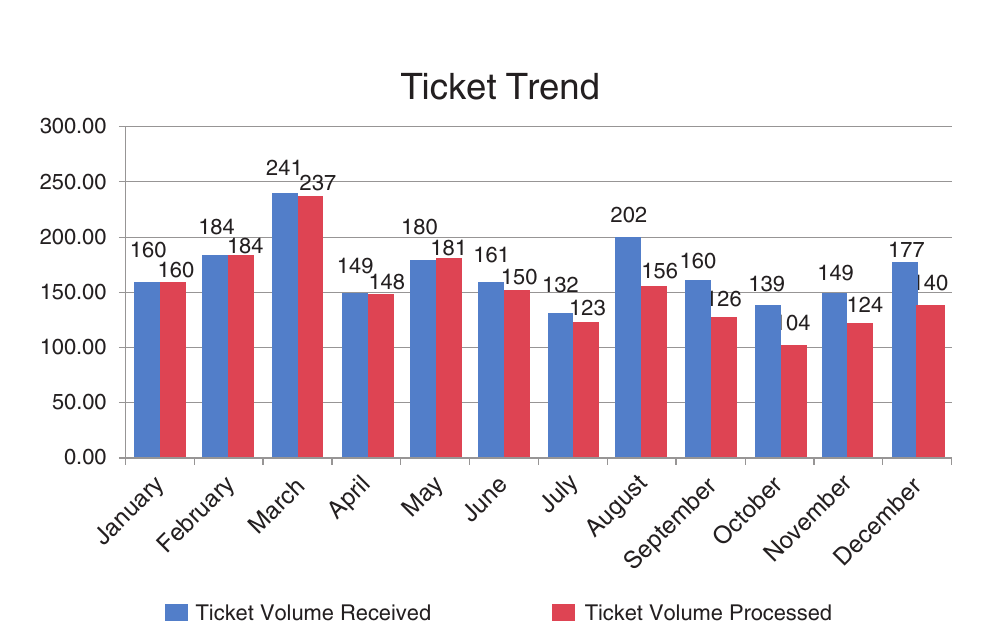
Case Study
- Highlight the key features to tell a story
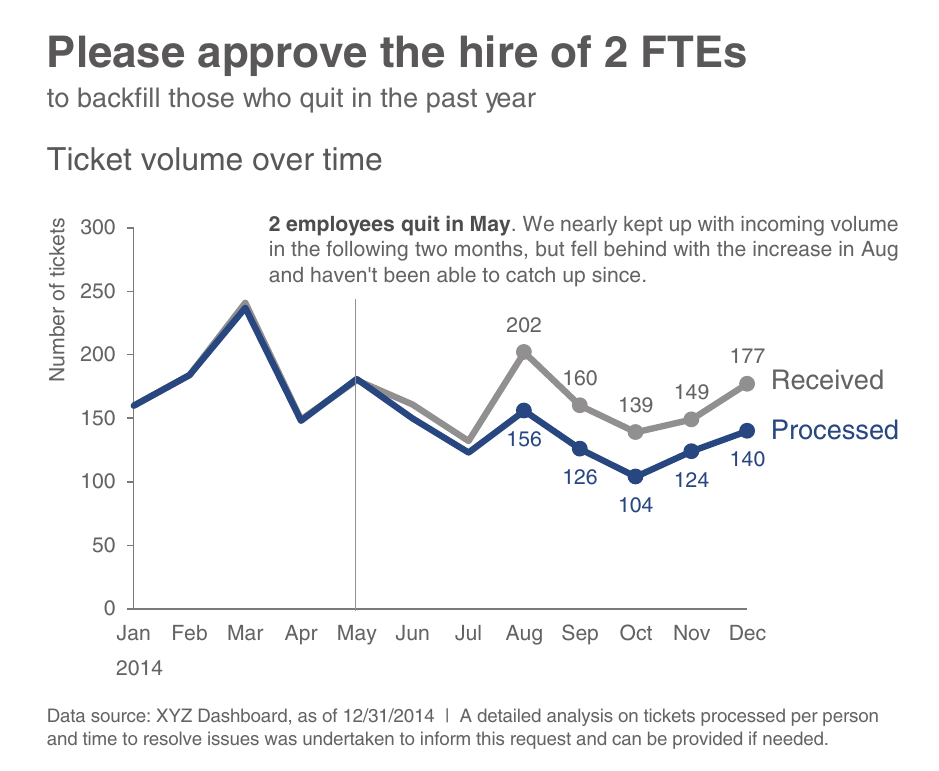
Storytelling 0.3
Course Website and Meetup
- Brightspace to submit homework
- Course Meetup: Monday 8:00-9:00PM
- Zoom Link
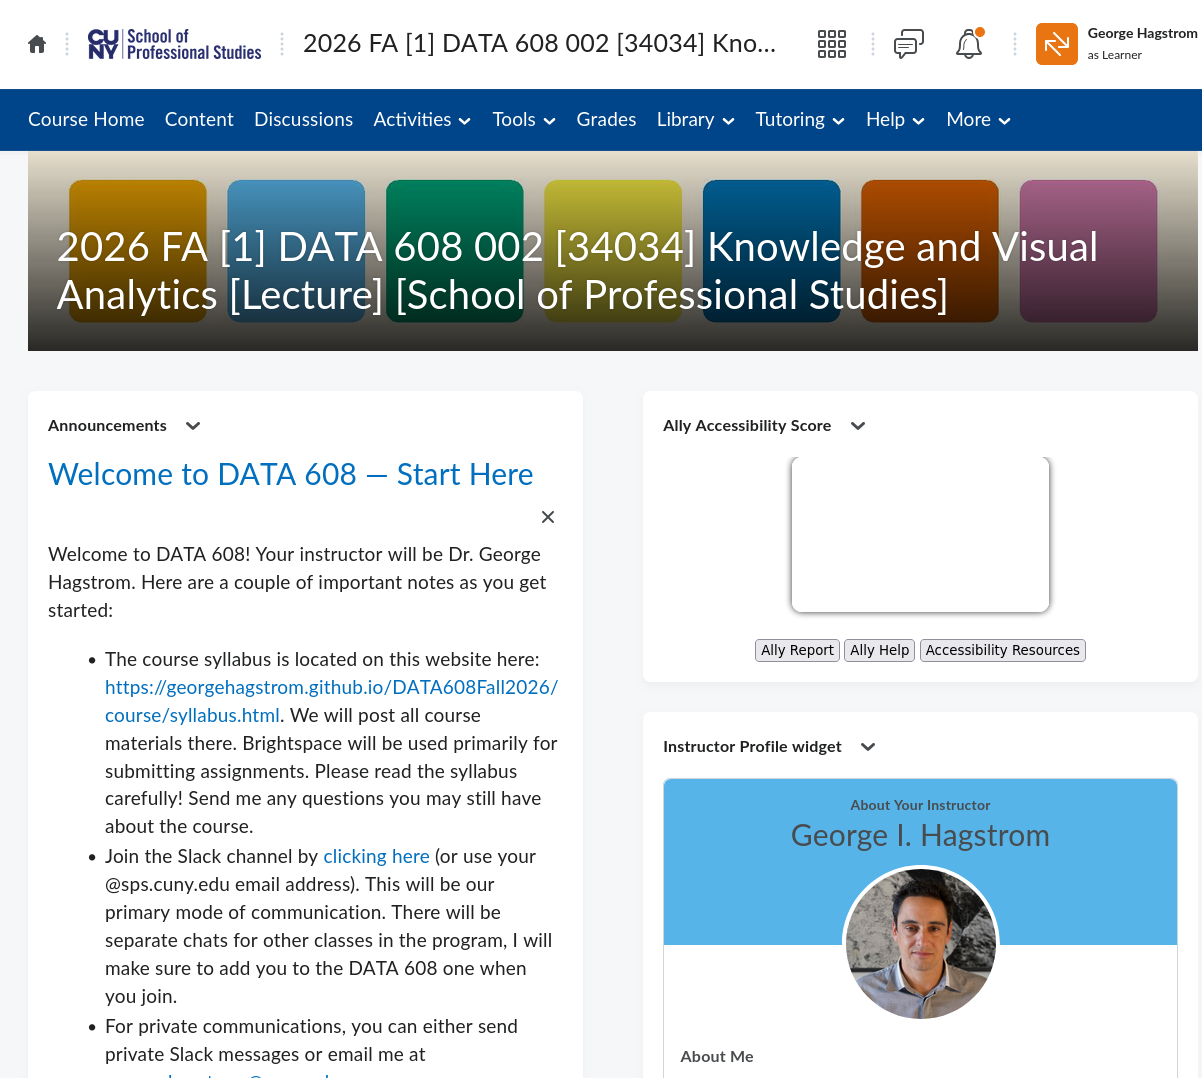
Slack Channel
- Course slack channel for messaging and rapid communications

Textbooks
Two most important textbooks:
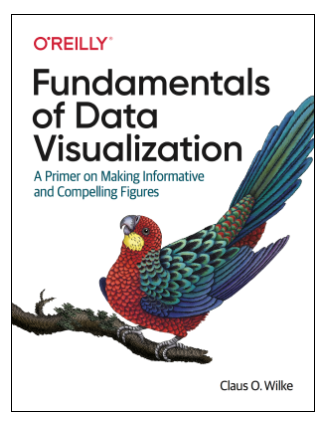
Textbooks
Two most important textbooks:
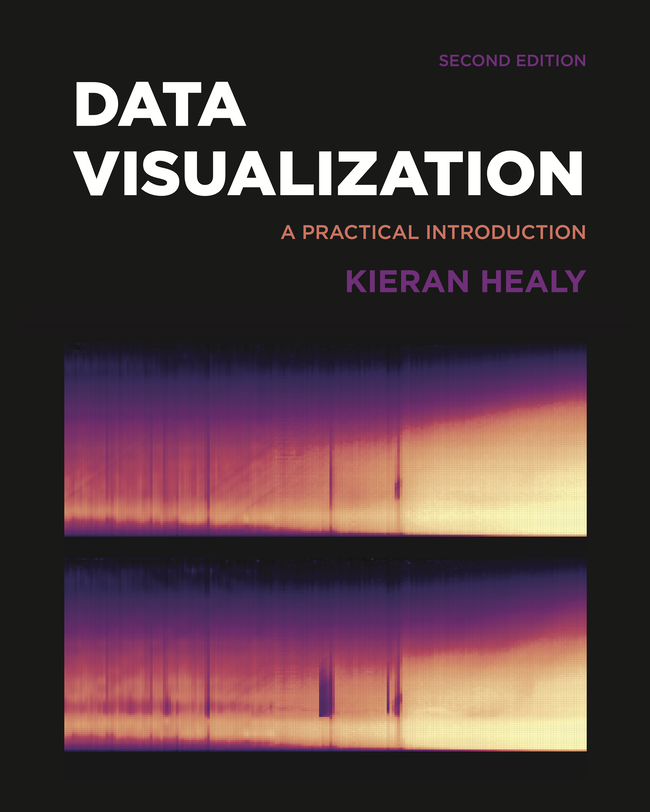
Textbooks
- For pythonistas

Textbooks
Useful for the story/business framing
- Storytelling with data
- Available free online at library Storytelling
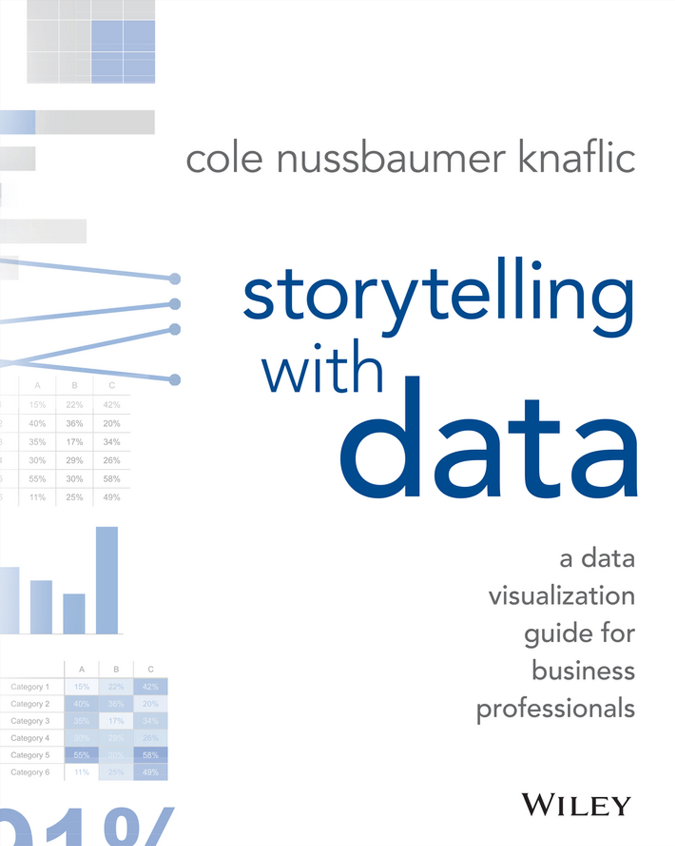
Textbooks
Useful for the story/business framing
- Storytelling with data
- Available free online at library Storytelling
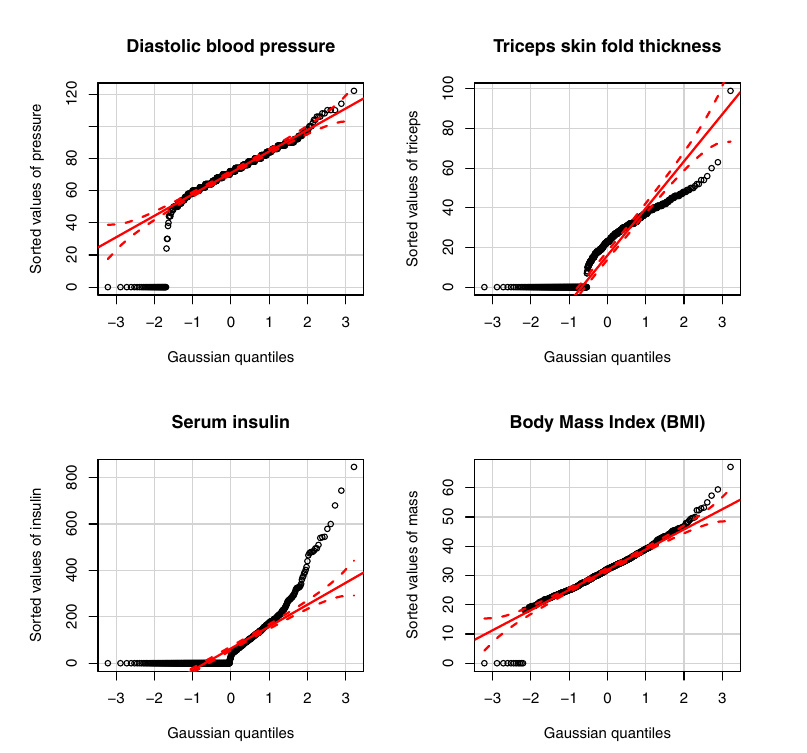
Context: Purposes of Visualizations
- Exploratory
- Explanatory
- Inferential
Context: Purposes of Visualizations
- Exploratory
- Explanatory
- Inferential
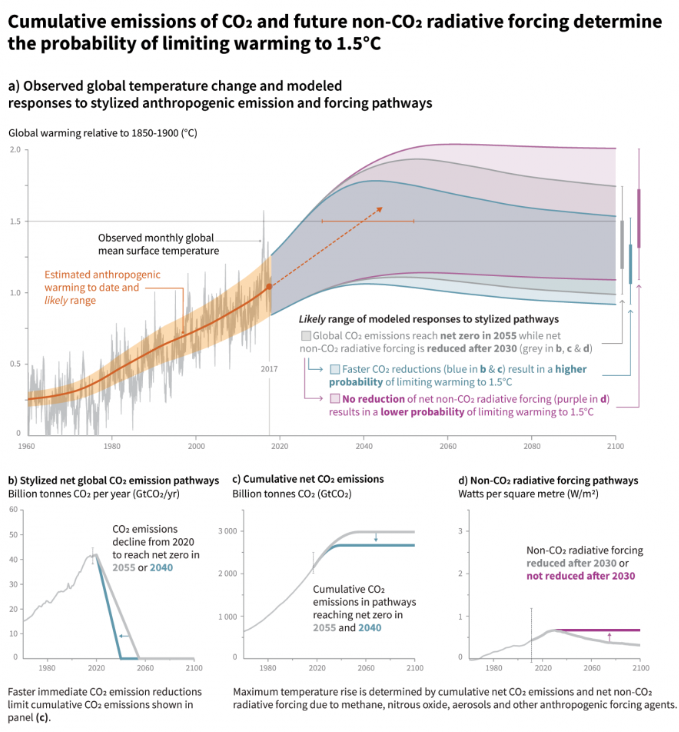
Context: Purposes of Visualizations
- Exploratory
- Explanatory
- Inferential
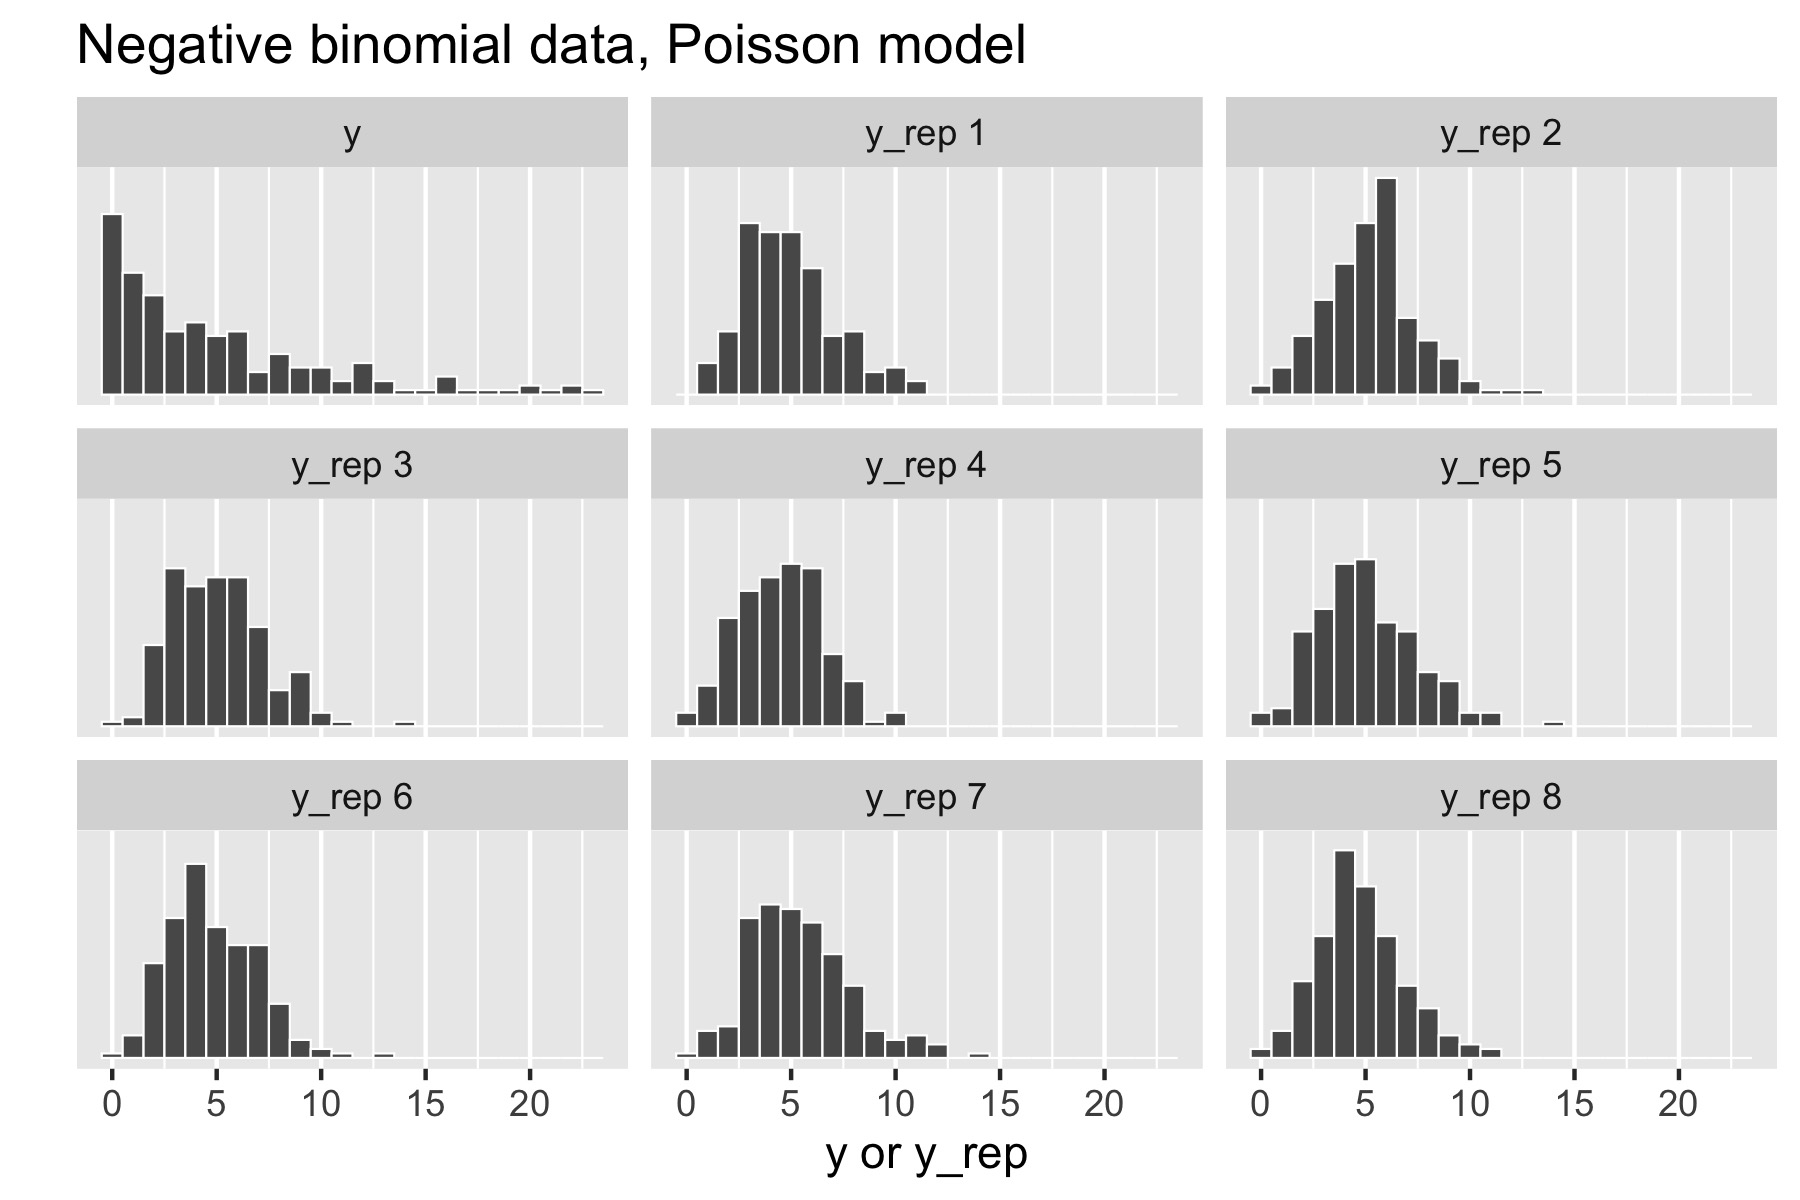
Context: Who, What, and How
- Figure for Decision Makers (IPCC SPM):
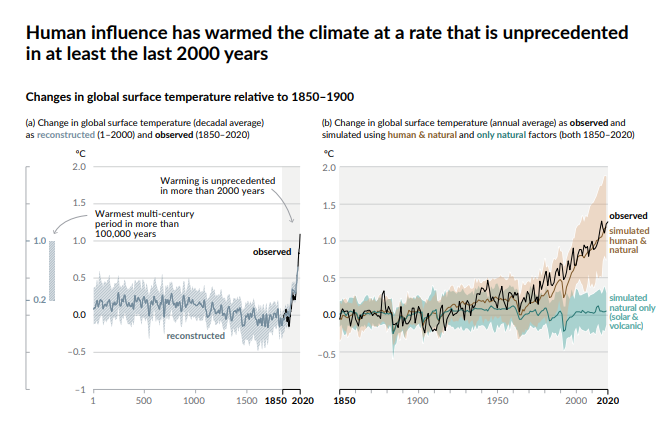
Context: Who, What, and How
- Figure for other scientists (IPCC)
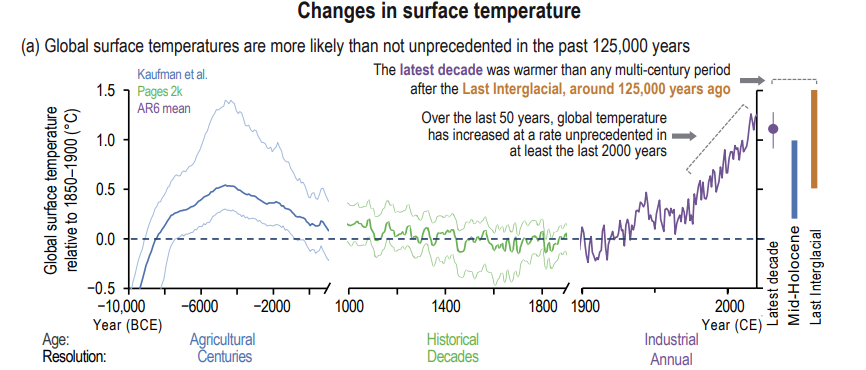
Context: Who, What, and How
- Figure for other scientists (IPCC)
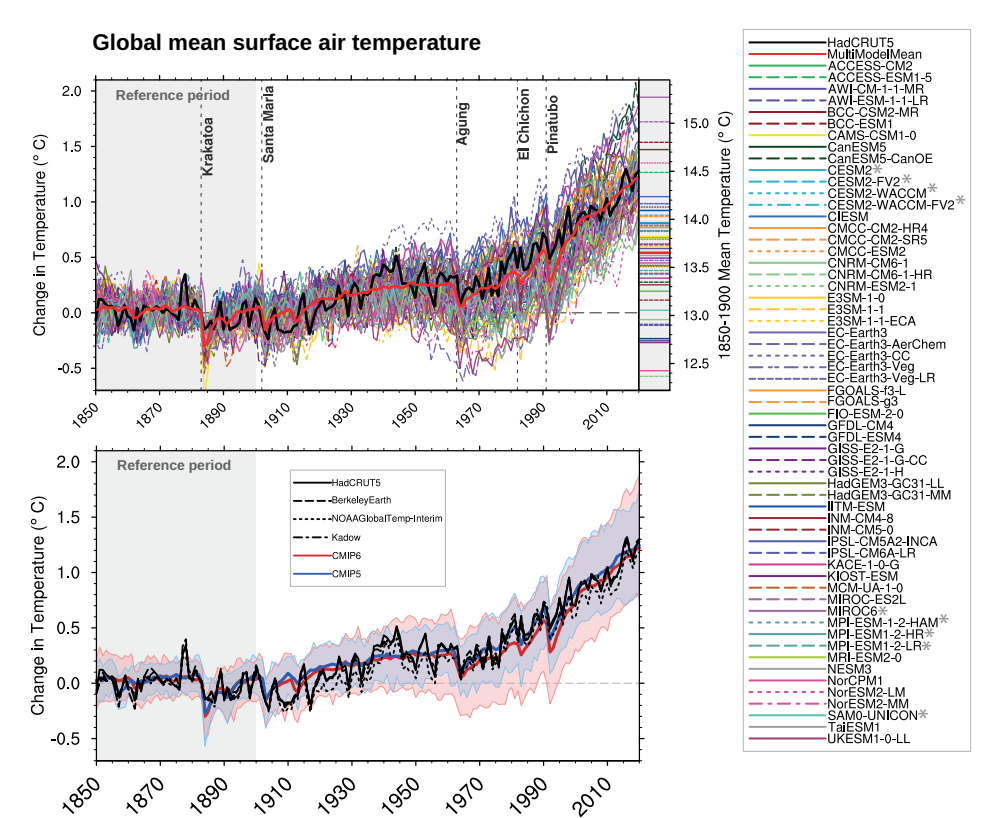
Context: Who, What, and How
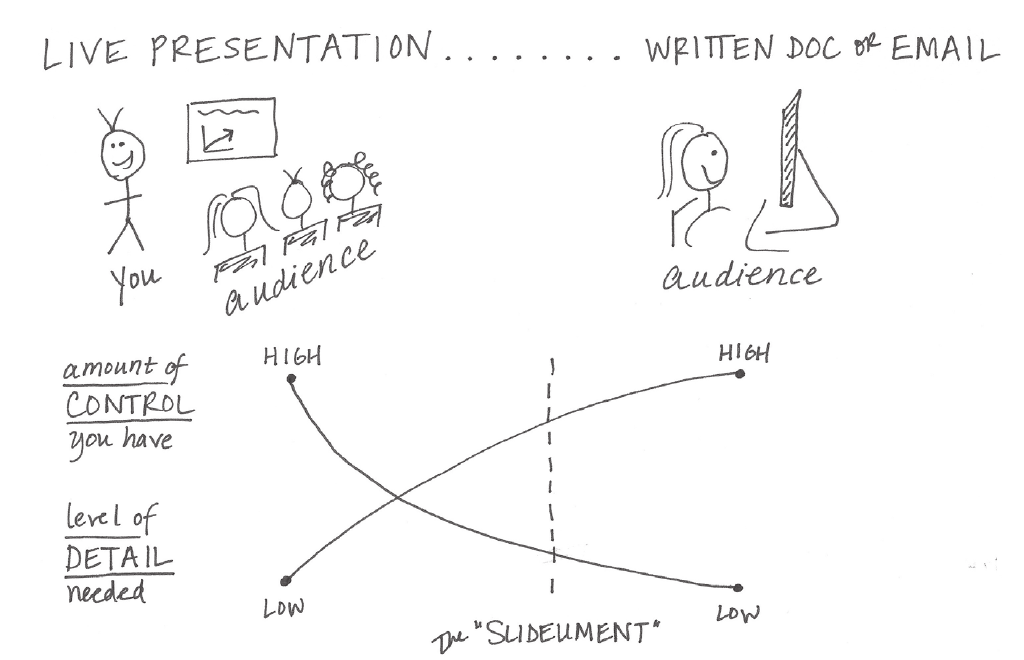
- Consider the Mechanism
- More details in written comms than presentations
Storytelling
Big Idea: Single Sentence Summary
- Convey your unique point of view
- Must convey what is at stake
Why Stories?
- Humans are wired to hear and tell stories, it is how we relate
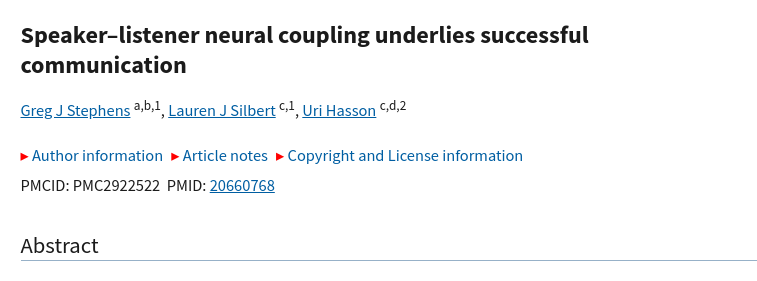
- Neuroscience research backs this up
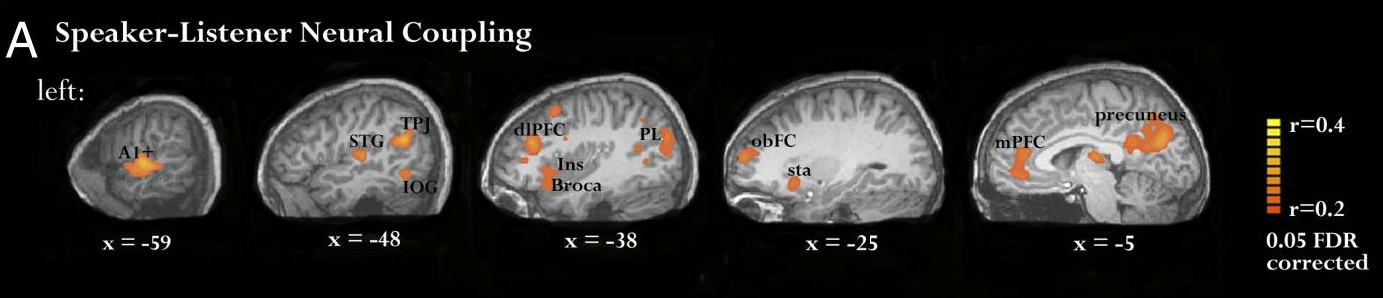
- Good stories create synchrony across multiple brain regions between storyteller and listener
Why Stories?
- Humans are wired to hear and tell stories, it is how we relate
- Neuroscience research backs this up
- Good stories create synchrony across multiple brain regions between storyteller and listener
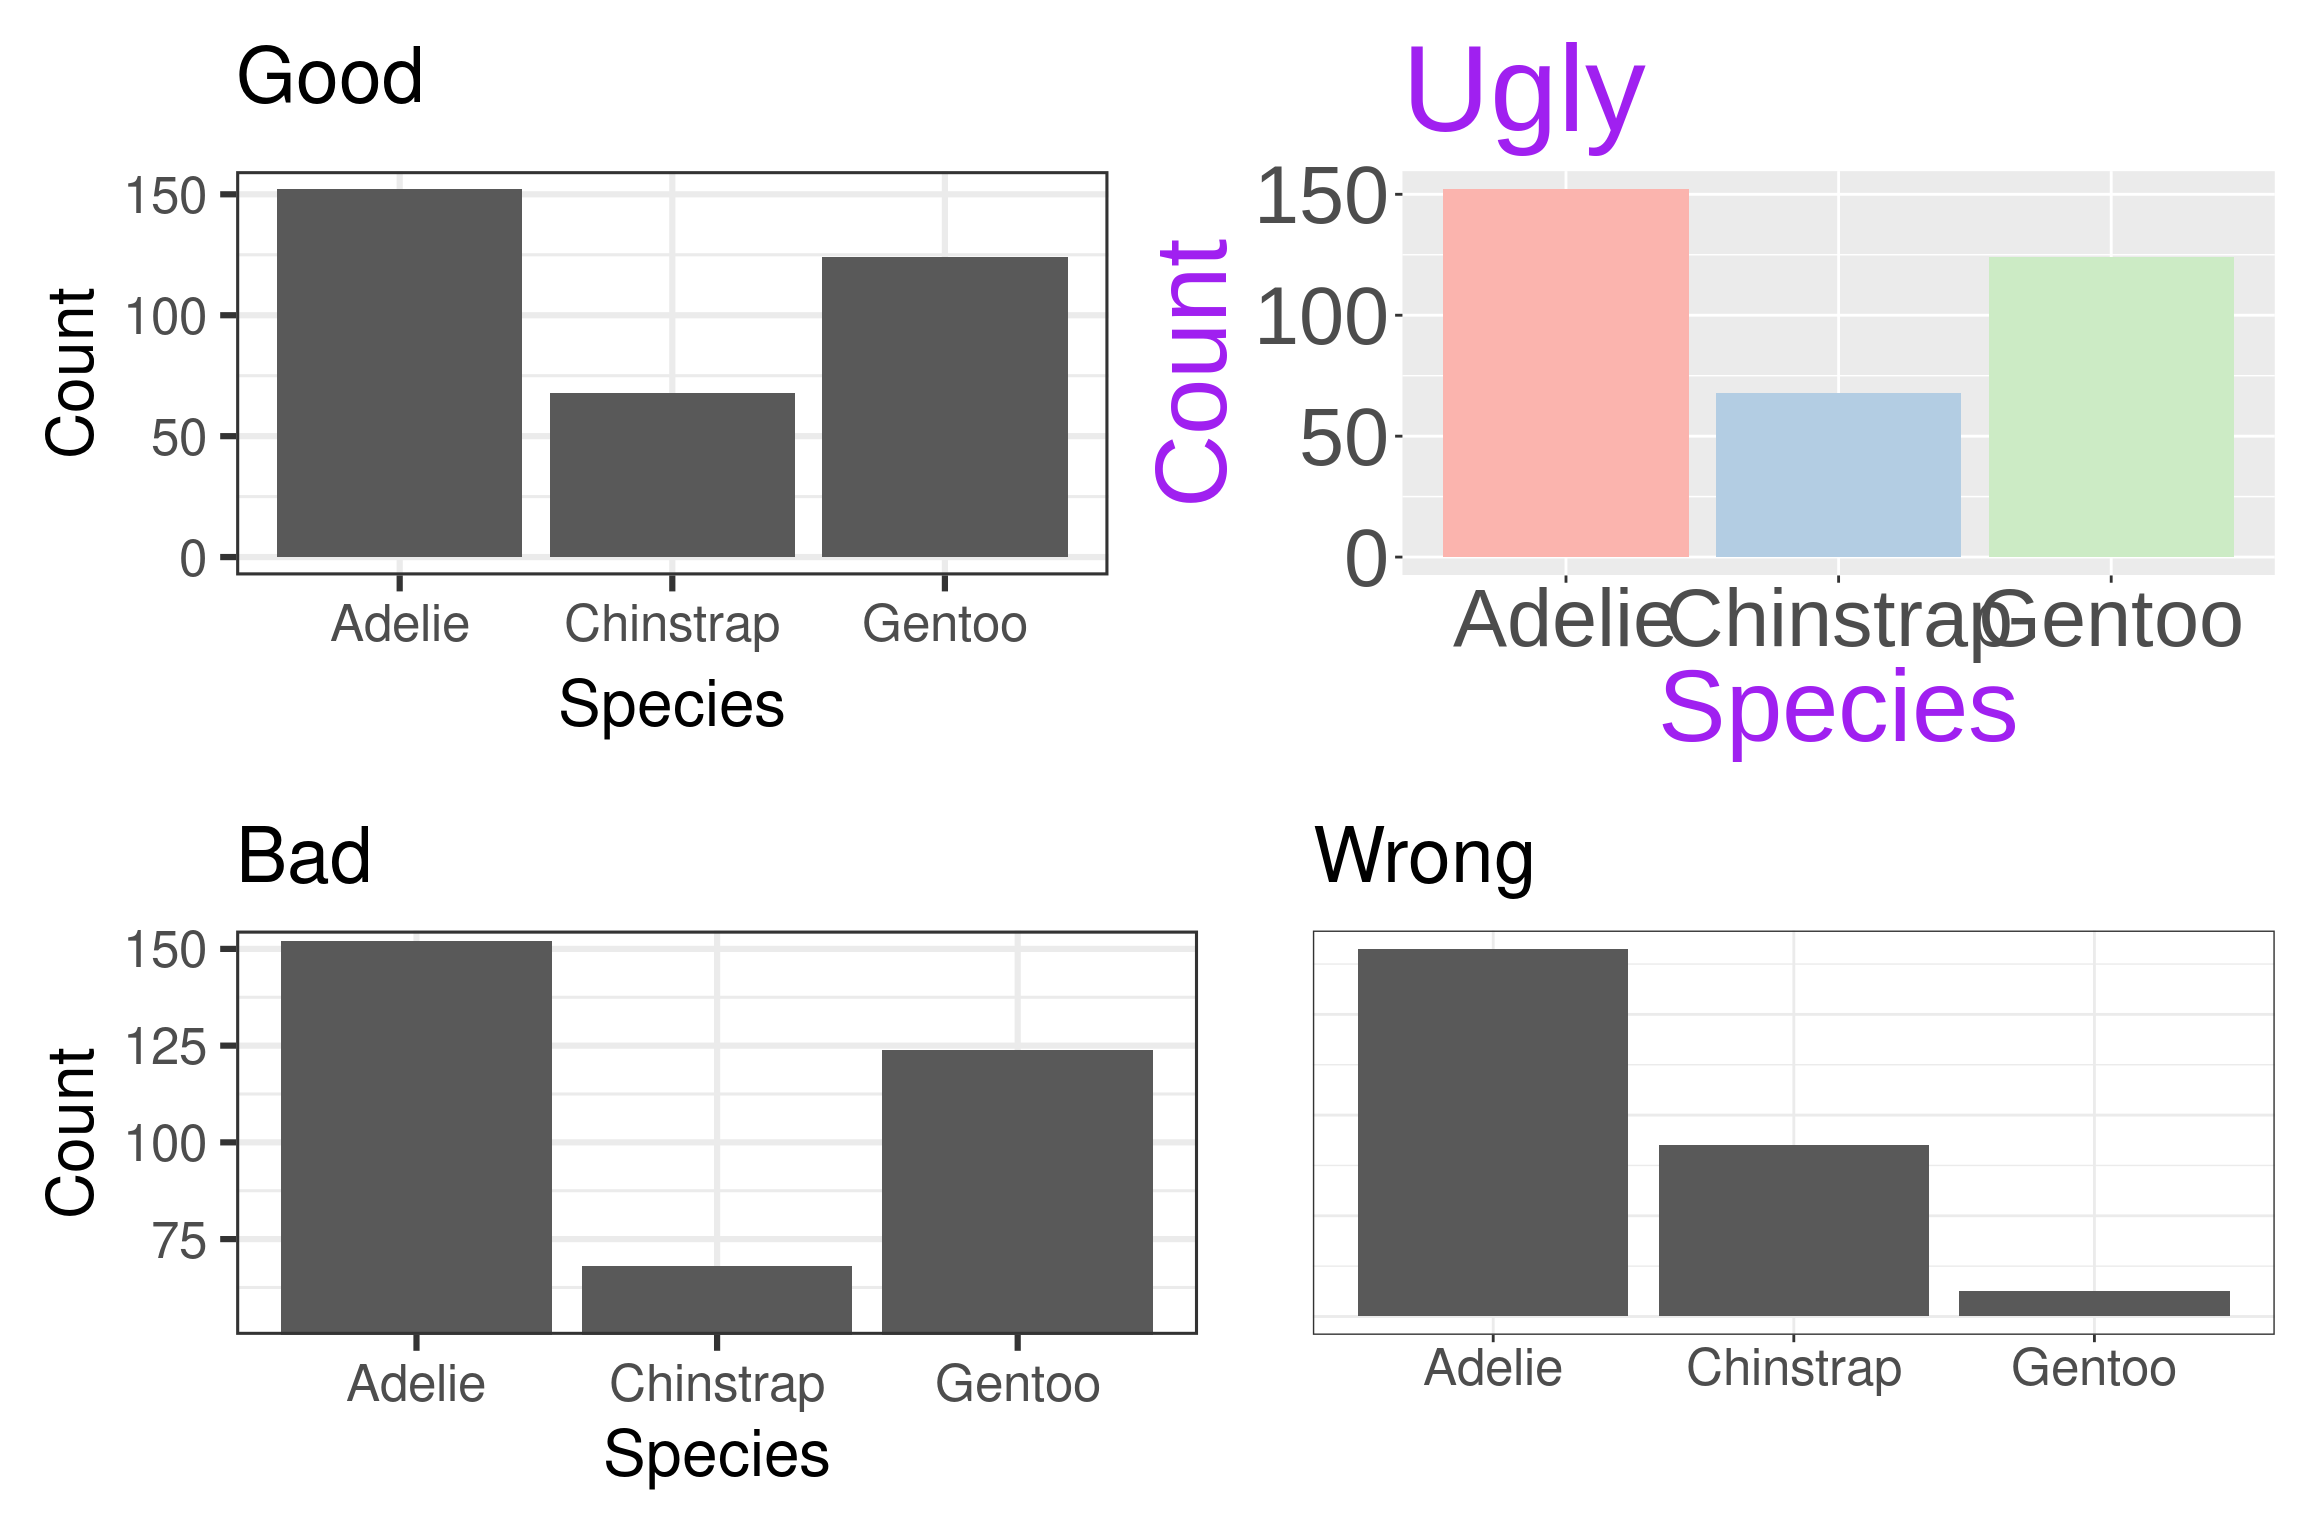
Bad, Ugly, and Wrong Figures
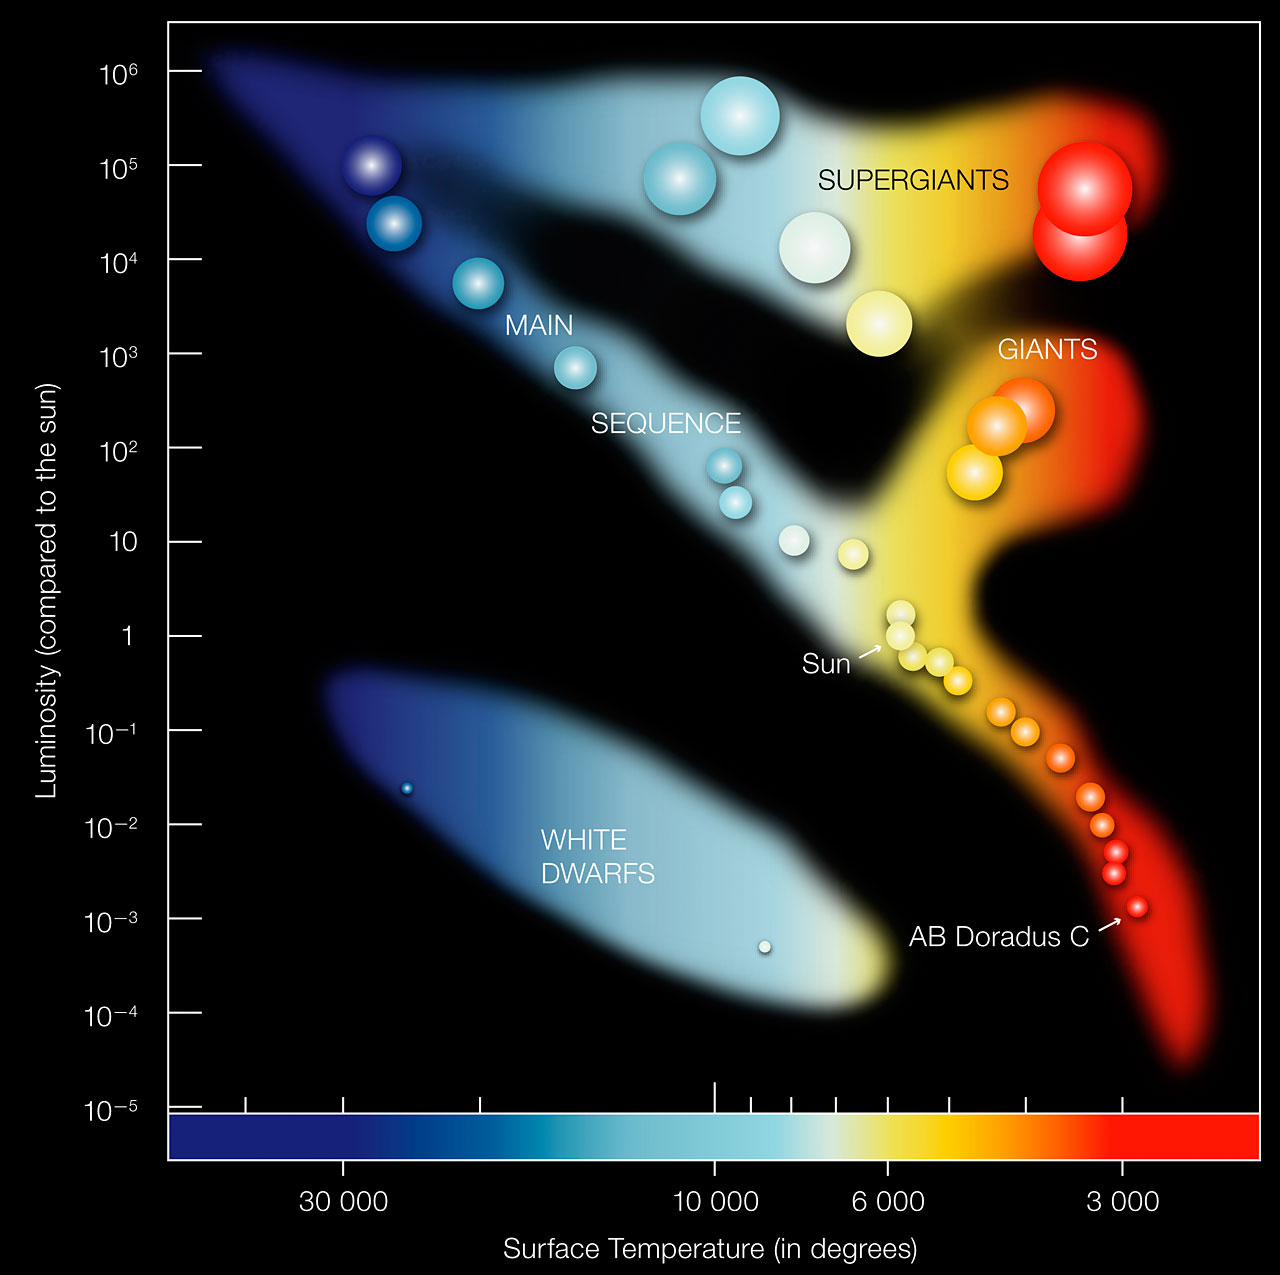
What About Great Figures?
- There are no principles/rules for going from good to great
- Perfect the good first, then your creativity can help you make something great
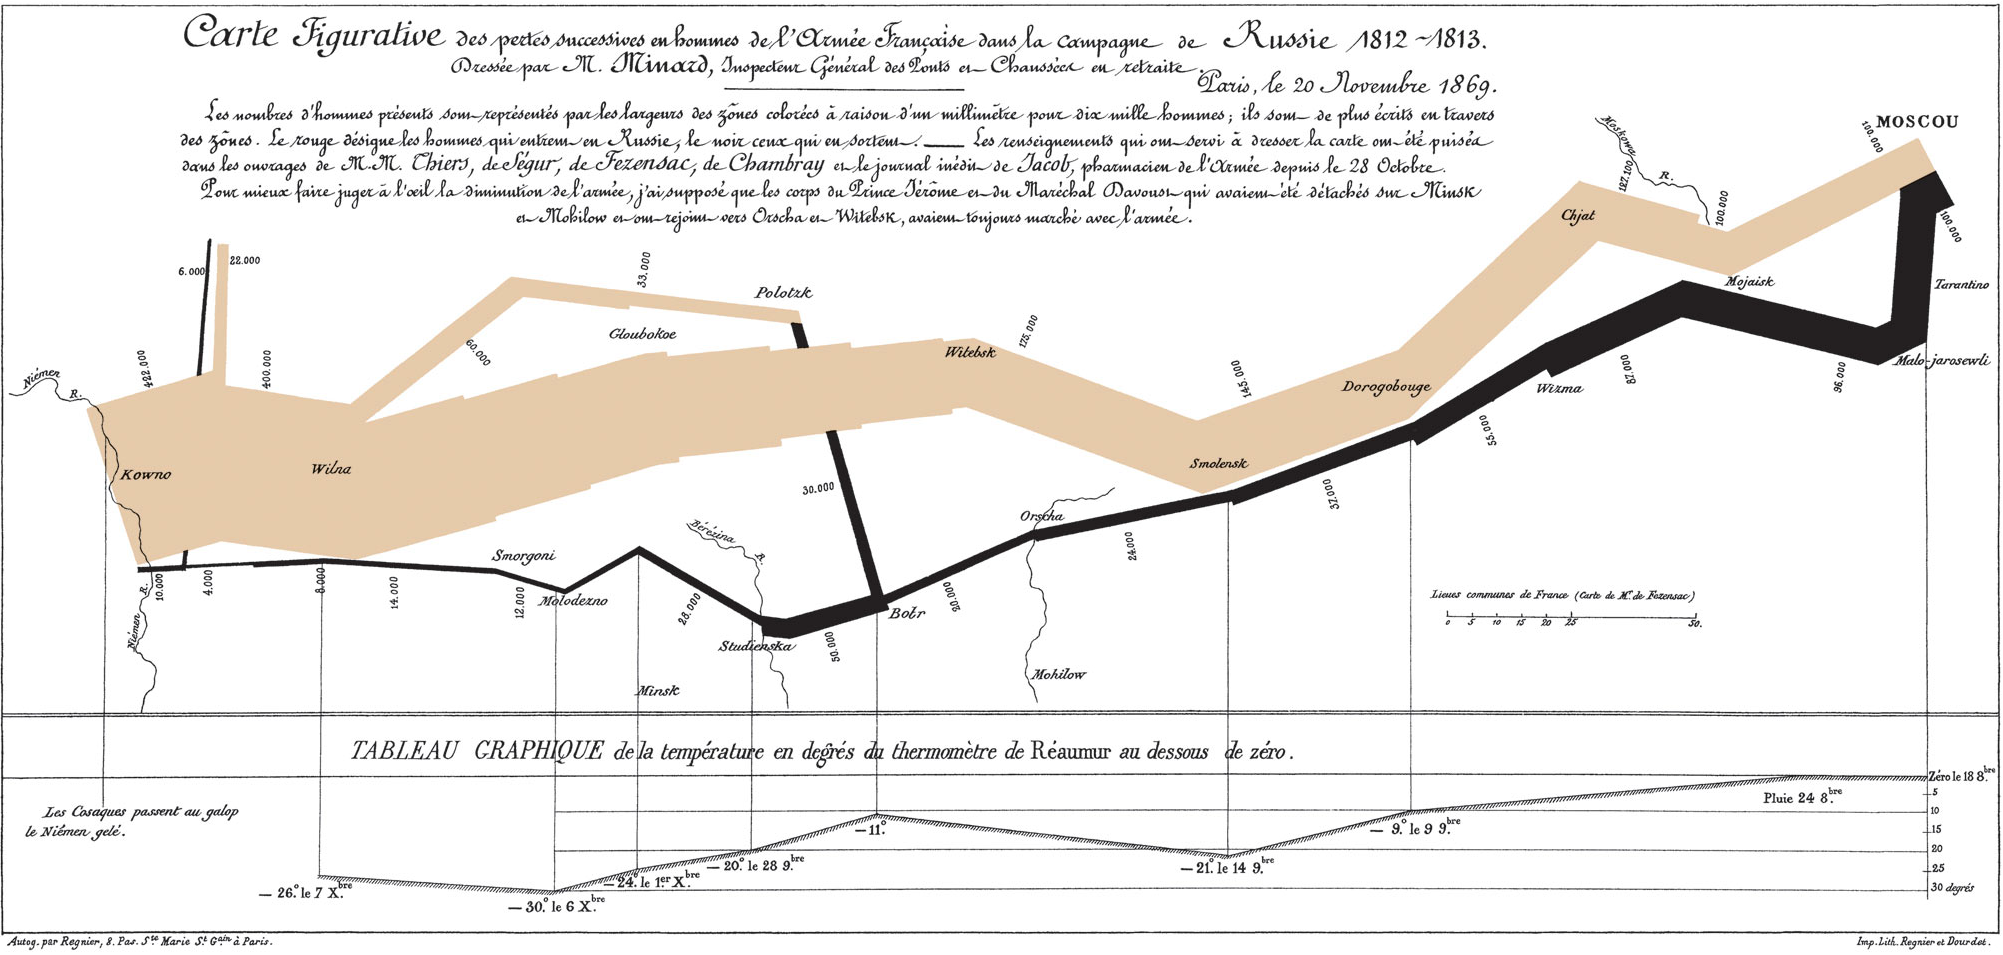
What About Great Figures?
- There are no principles/rules for going from good to great
- Perfect the good first, then your creativity can help you make something great
Thanks!