| Alcohol | Malic | Ash | Alcalinity | Magnesium | Phenols | Flavanoids | Nonflavanoids | Proanthocyanins | Color | Hue | Dilution | Proline |
|---|---|---|---|---|---|---|---|---|---|---|---|---|
| 14.23 | 1.71 | 2.43 | 15.6 | 127 | 2.80 | 3.06 | 0.28 | 2.29 | 5.64 | 1.04 | 3.92 | 1065 |
| 13.20 | 1.78 | 2.14 | 11.2 | 100 | 2.65 | 2.76 | 0.26 | 1.28 | 4.38 | 1.05 | 3.40 | 1050 |
| 13.16 | 2.36 | 2.67 | 18.6 | 101 | 2.80 | 3.24 | 0.30 | 2.81 | 5.68 | 1.03 | 3.17 | 1185 |
| 14.37 | 1.95 | 2.50 | 16.8 | 113 | 3.85 | 3.49 | 0.24 | 2.18 | 7.80 | 0.86 | 3.45 | 1480 |
| 13.24 | 2.59 | 2.87 | 21.0 | 118 | 2.80 | 2.69 | 0.39 | 1.82 | 4.32 | 1.04 | 2.93 | 735 |
| 14.20 | 1.76 | 2.45 | 15.2 | 112 | 3.27 | 3.39 | 0.34 | 1.97 | 6.75 | 1.05 | 2.85 | 1450 |
| 14.39 | 1.87 | 2.45 | 14.6 | 96 | 2.50 | 2.52 | 0.30 | 1.98 | 5.25 | 1.02 | 3.58 | 1290 |
| 14.06 | 2.15 | 2.61 | 17.6 | 121 | 2.60 | 2.51 | 0.31 | 1.25 | 5.05 | 1.06 | 3.58 | 1295 |
| 14.83 | 1.64 | 2.17 | 14.0 | 97 | 2.80 | 2.98 | 0.29 | 1.98 | 5.20 | 1.08 | 2.85 | 1045 |
| 13.86 | 1.35 | 2.27 | 16.0 | 98 | 2.98 | 3.15 | 0.22 | 1.85 | 7.22 | 1.01 | 3.55 | 1045 |
DATA 608 Meetup 11: Clustering
George I. Hagstrom
Week Summary
- Data Story 6 is available, due Sunday November 22
- Last Data Story will be on Shiny Apps
- Talking about clustering today
Clustering and Dim. Reduction
- We can gain insight when we notice data points cluster together
Clustering and Dim. Reduction
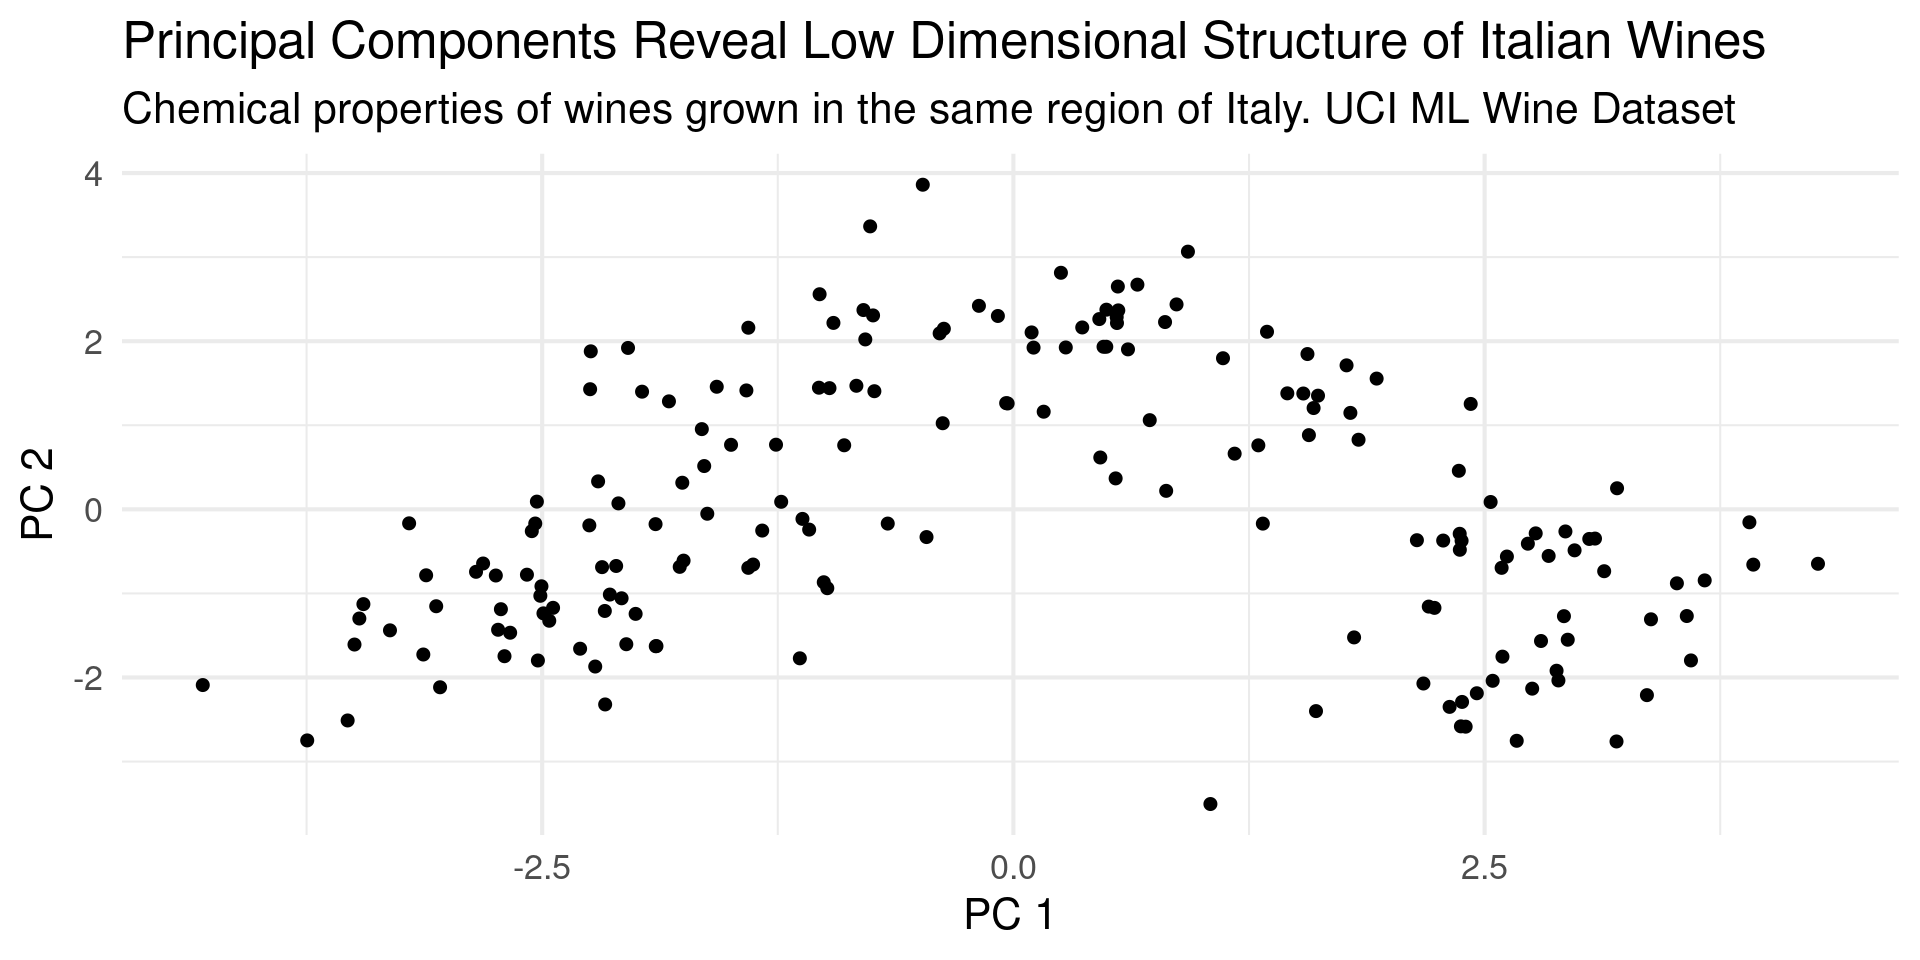
Clustering and Dim. Reduction
- Color by the grape type
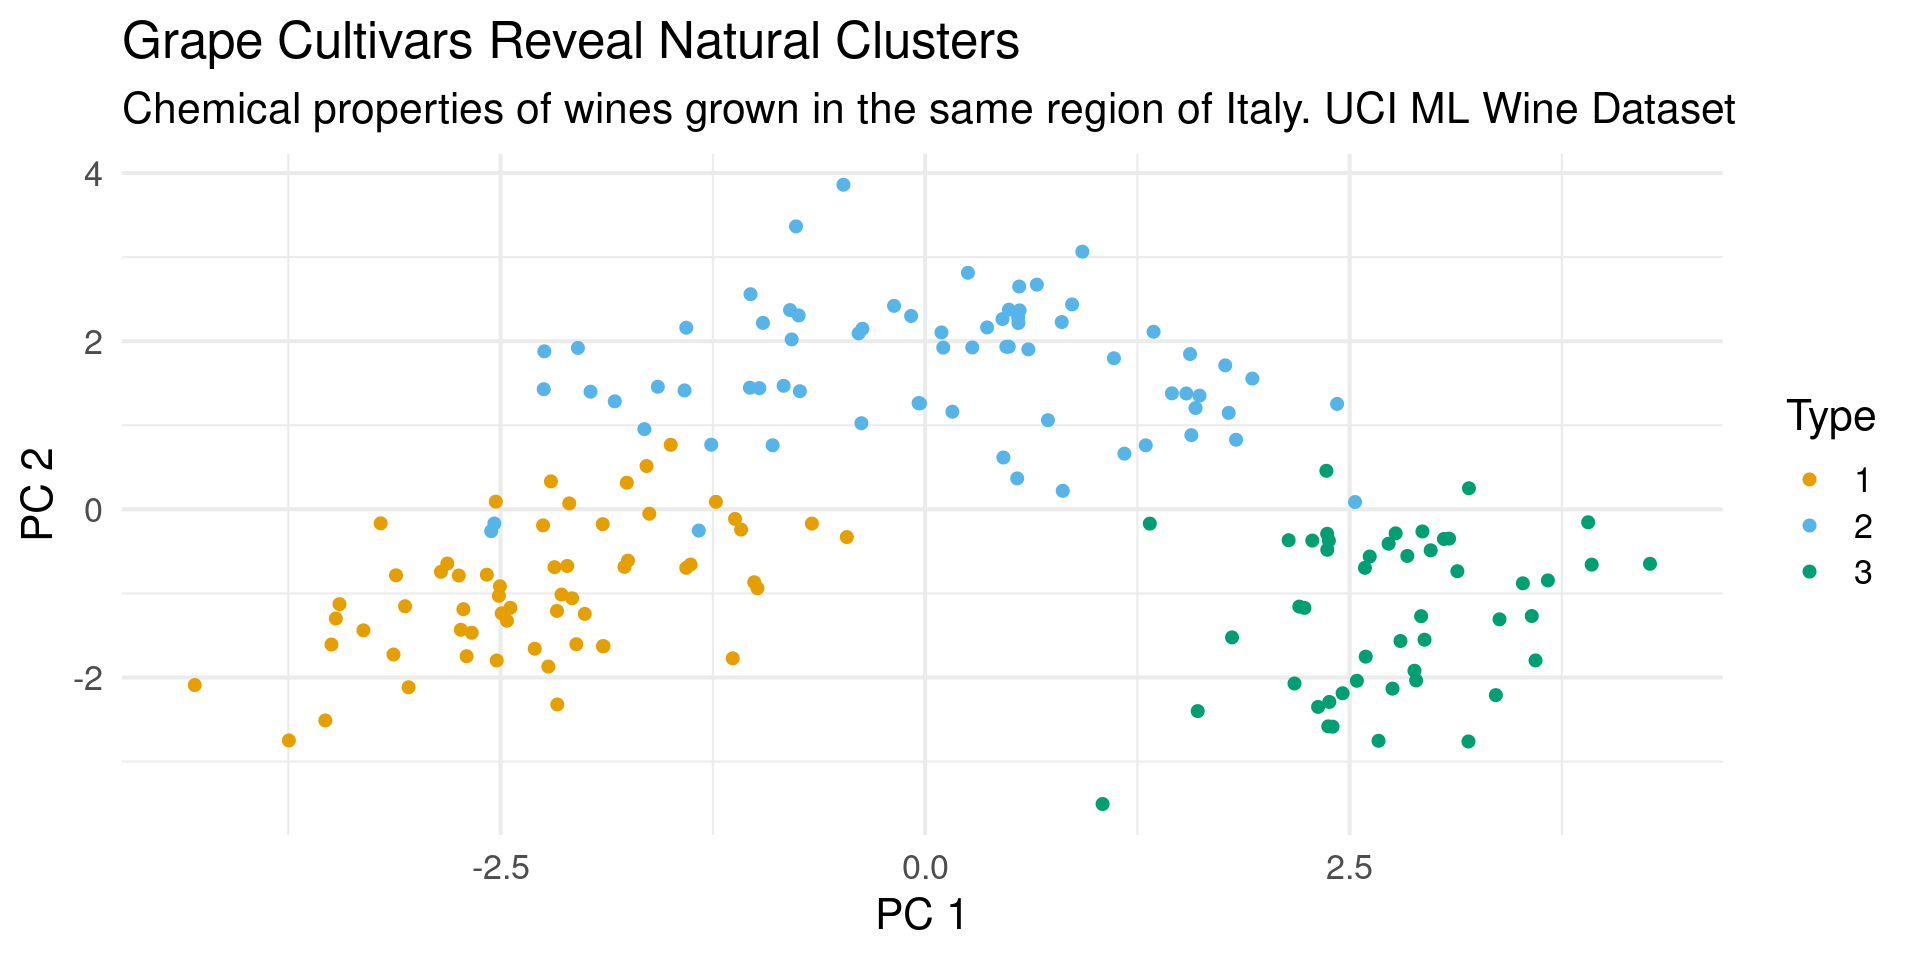
Automatic Clustering
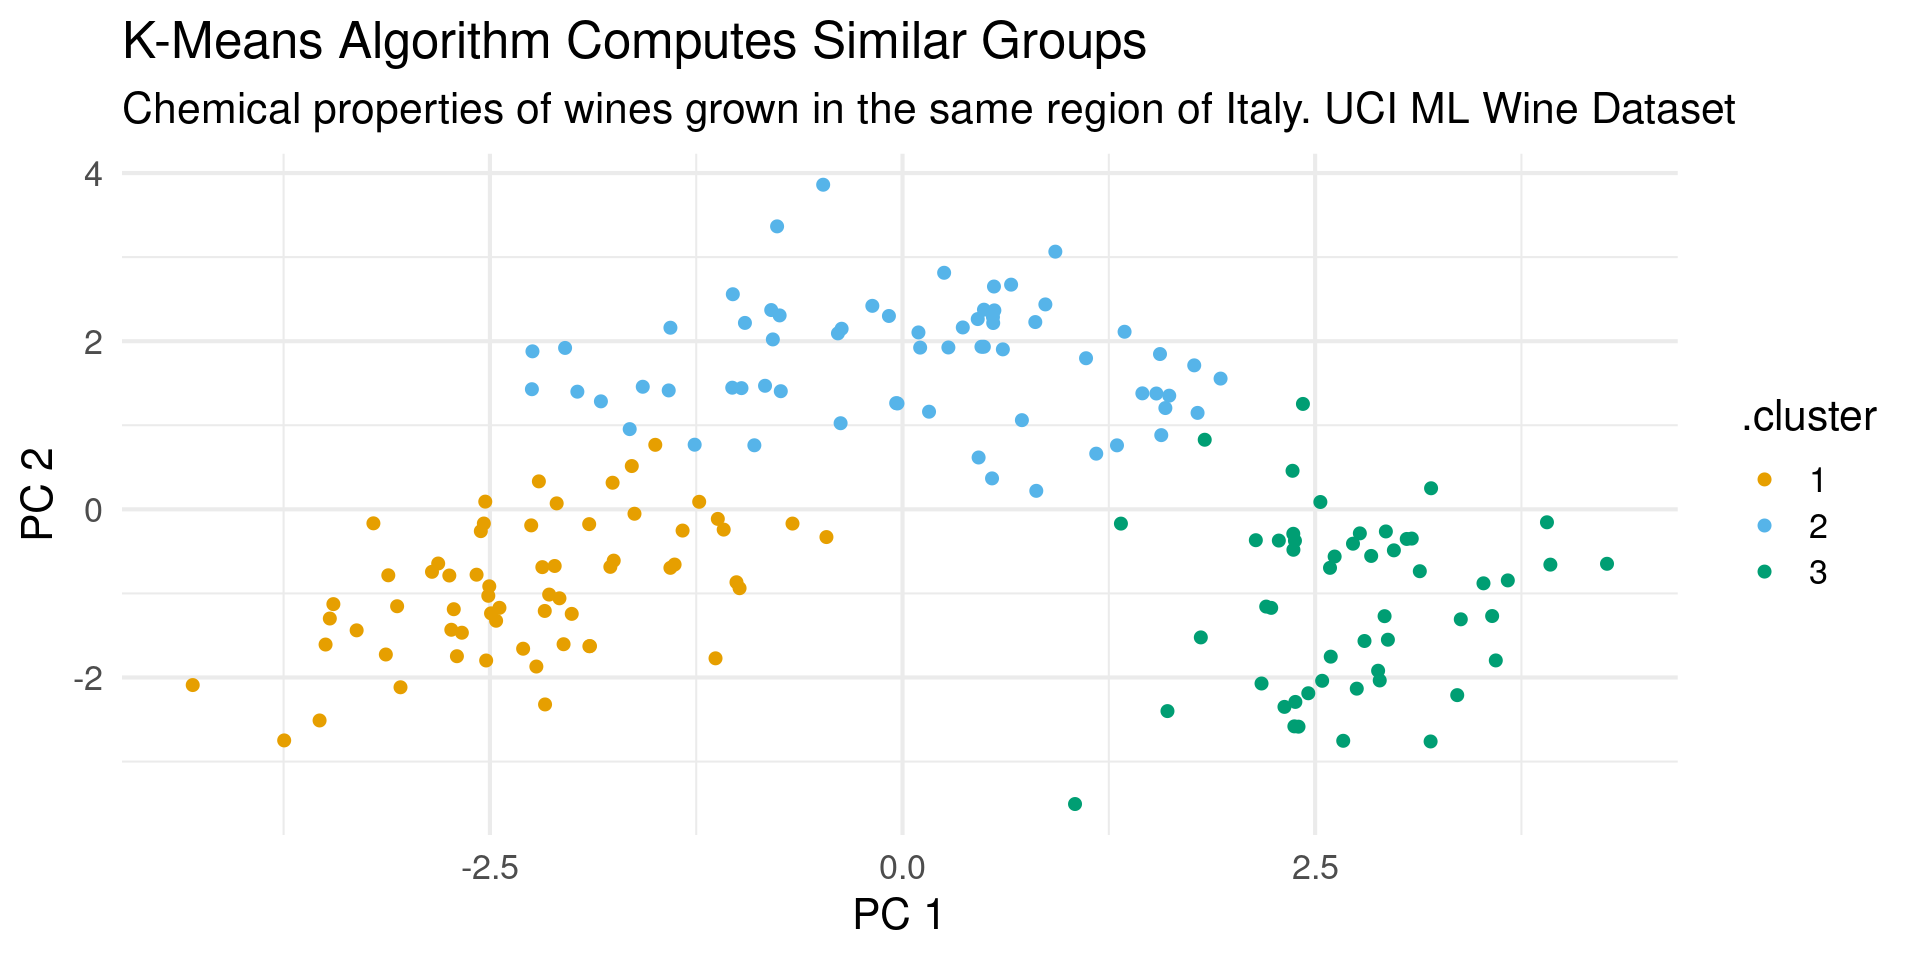
k-means method
- Most common clustering method
- Needs two things:
- Measure of distance between points
- Number of Clusters to find
- Each cluster characterized by a center
- Points clustered to closest center
k-means method
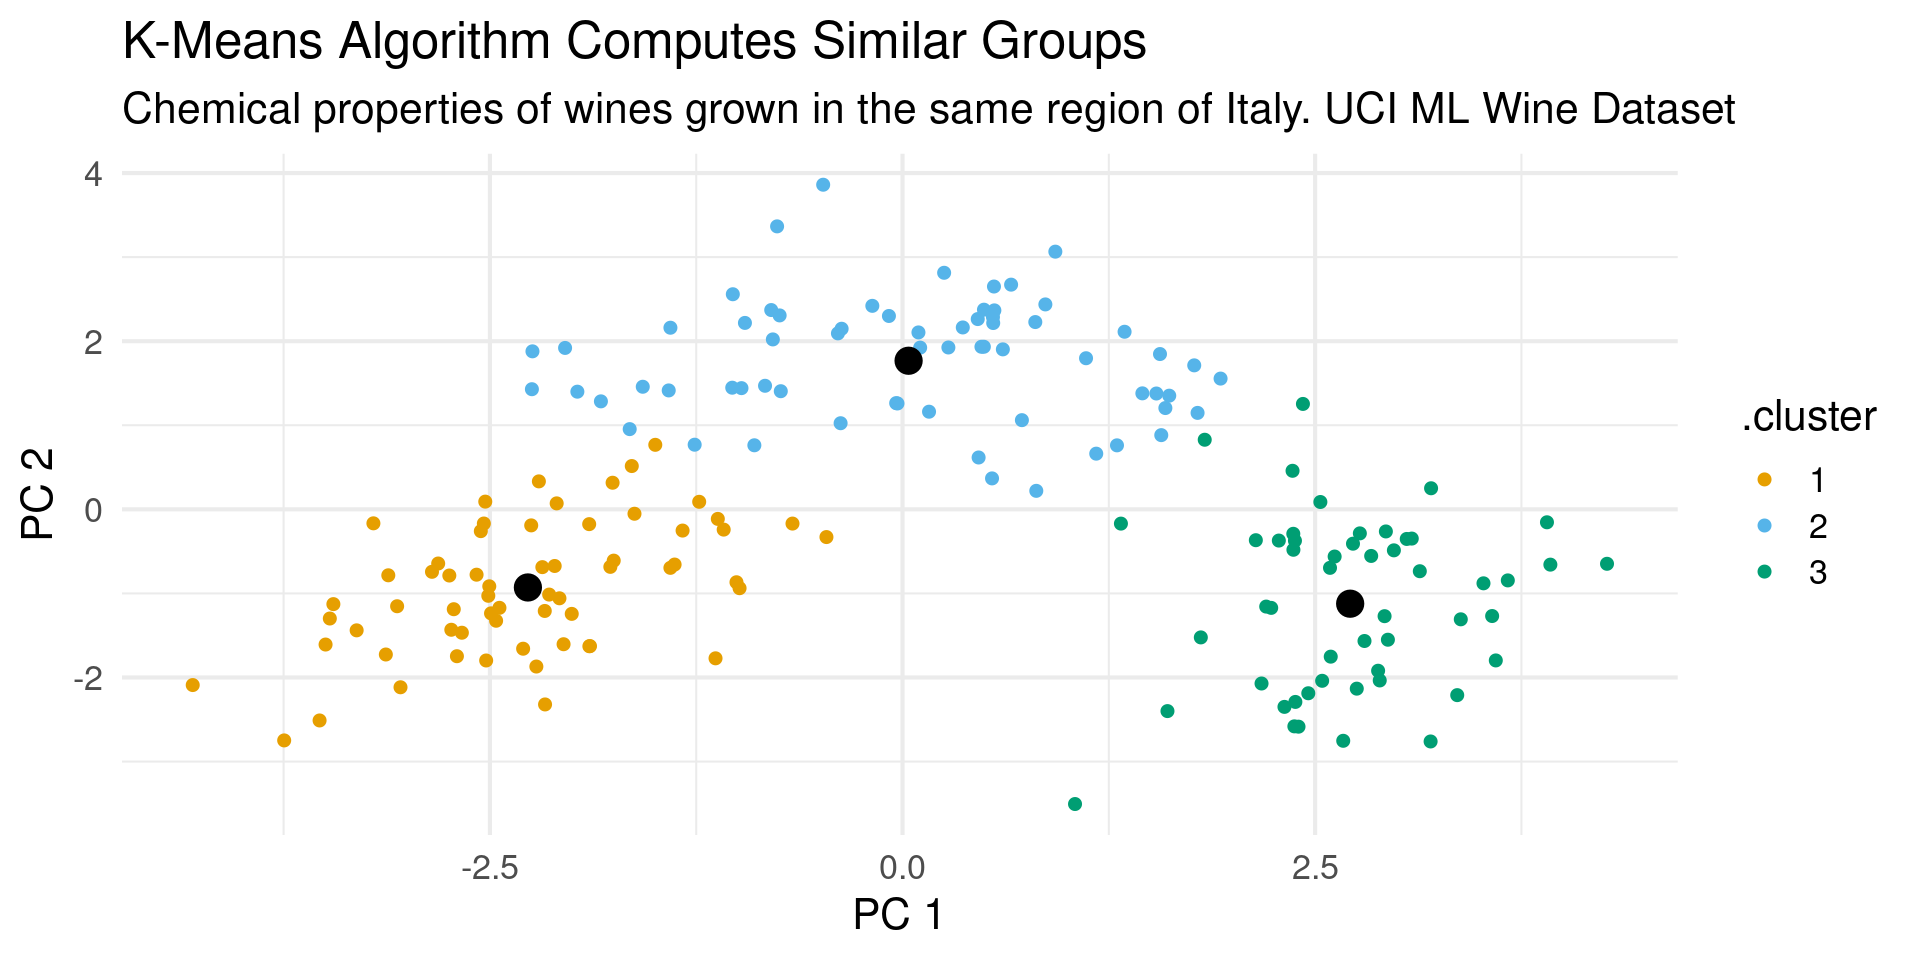
Implementing k-means in R
- kmeans in stats package
wine_clusters = pca_fit|>
    augment(wine_df) |> select(-Type) |>
  select(.fittedPC1:.fittedPC13) |>
  kmeans(centers=3,nstart = 10)

wine_clusters
K-means clustering with 3 clusters of sizes 65, 62, 51
Cluster means:
.fittedPC1 .fittedPC2 .fittedPC3 .fittedPC4 .fittedPC5 .fittedPC6
1 0.03685265 1.7672542 0.185615130 0.08001400 -0.07067870 0.12944063
2 -2.26979079 -0.9294322 0.001523733 -0.13511700 0.13453261 -0.21766922
3 2.71238444 -1.1224849 -0.238420685 0.06228125 -0.07346875 0.09964414
.fittedPC7 .fittedPC8 .fittedPC9 .fittedPC10 .fittedPC11 .fittedPC12
1 -0.002320739 -0.017964647 -0.03216049 0.02293882 0.013900922 0.004371673
2 0.051963343 0.024894027 0.05014407 -0.07446923 -0.021230820 -0.007417378
3 -0.060213318 -0.007367207 -0.01997059 0.06129547 0.008093155 0.003445464
.fittedPC13
1 0.008595707
2 -0.050476861
3 0.050408713
Clustering vector:
  [1] 2 2 2 2 2 2 2 2 2 2 2 2 2 2 2 2 2 2 2 2 2 2 2 2 2 2 2 2 2 2 2 2 2 2 2 2 2
 [38] 2 2 2 2 2 2 2 2 2 2 2 2 2 2 2 2 2 2 2 2 2 2 1 1 3 1 1 1 1 1 1 1 1 1 1 1 2
 [75] 1 1 1 1 1 1 1 1 1 3 1 1 1 1 1 1 1 1 1 1 1 2 1 1 1 1 1 1 1 1 1 1 1 1 1 1 1
[112] 1 1 1 1 1 1 1 3 1 1 2 1 1 1 1 1 1 1 1 3 3 3 3 3 3 3 3 3 3 3 3 3 3 3 3 3 3
[149] 3 3 3 3 3 3 3 3 3 3 3 3 3 3 3 3 3 3 3 3 3 3 3 3 3 3 3 3 3 3
Within cluster sum of squares by cluster:
[1] 558.6971 385.6983 326.3537
(between_SS / total_SS = 44.8 %)
Available components:
[1] "cluster" "centers" "totss" "withinss" "tot.withinss"
[6] "betweenss" "size" "iter" "ifault" Key arguments
centersspecies the number of clusters to findnstartis number of times to initialize algorithmalgorithmseveral choices the default choice is usually very robustiter.maxis the number of iterations to try
Key Outputs
- Clustering Vector: Identifies each point by cluster. Is attached to original data frame by augmnet
[1] 2 2 2 2 2 2 2 2 2 2 2 2 2 2 2 2 2 2 2 2 2 2 2 2 2 2 2 2 2 2 2 2 2 2 2 2 2
[38] 2 2 2 2 2 2 2 2 2 2 2 2 2 2 2 2 2 2 2 2 2 2 1 1 3 1 1 1 1 1 1 1 1 1 1 1 2
[75] 1 1 1 1 1 1 1 1 1 3 1 1 1 1 1 1 1 1 1 1 1 2 1 1 1 1 1 1 1 1 1 1 1 1 1 1 1
[112] 1 1 1 1 1 1 1 3 1 1 2 1 1 1 1 1 1 1 1 3 3 3 3 3 3 3 3 3 3 3 3 3 3 3 3 3 3
[149] 3 3 3 3 3 3 3 3 3 3 3 3 3 3 3 3 3 3 3 3 3 3 3 3 3 3 3 3 3 3Key Outputs
- Cluster Means: These are the cluster centers
   .fittedPC1 .fittedPC2   .fittedPC3  .fittedPC4  .fittedPC5  .fittedPC6
1  0.03685265  1.7672542  0.185615130  0.08001400 -0.07067870  0.12944063
2 -2.26979079 -0.9294322  0.001523733 -0.13511700  0.13453261 -0.21766922
3  2.71238444 -1.1224849 -0.238420685  0.06228125 -0.07346875  0.09964414
    .fittedPC7   .fittedPC8  .fittedPC9 .fittedPC10  .fittedPC11  .fittedPC12
1 -0.002320739 -0.017964647 -0.03216049  0.02293882  0.013900922  0.004371673
2  0.051963343  0.024894027  0.05014407 -0.07446923 -0.021230820 -0.007417378
3 -0.060213318 -0.007367207 -0.01997059  0.06129547  0.008093155  0.003445464
   .fittedPC13
1  0.008595707
2 -0.050476861
3  0.050408713
Key Outputs
- Error Measurements
withinsssum of squares within clustersbetweenssbetween cluster sum of squarestot.withinss/totssmeasure of how much clusters explain variance
How many clusters?
- What happens when we increase the number of centers?
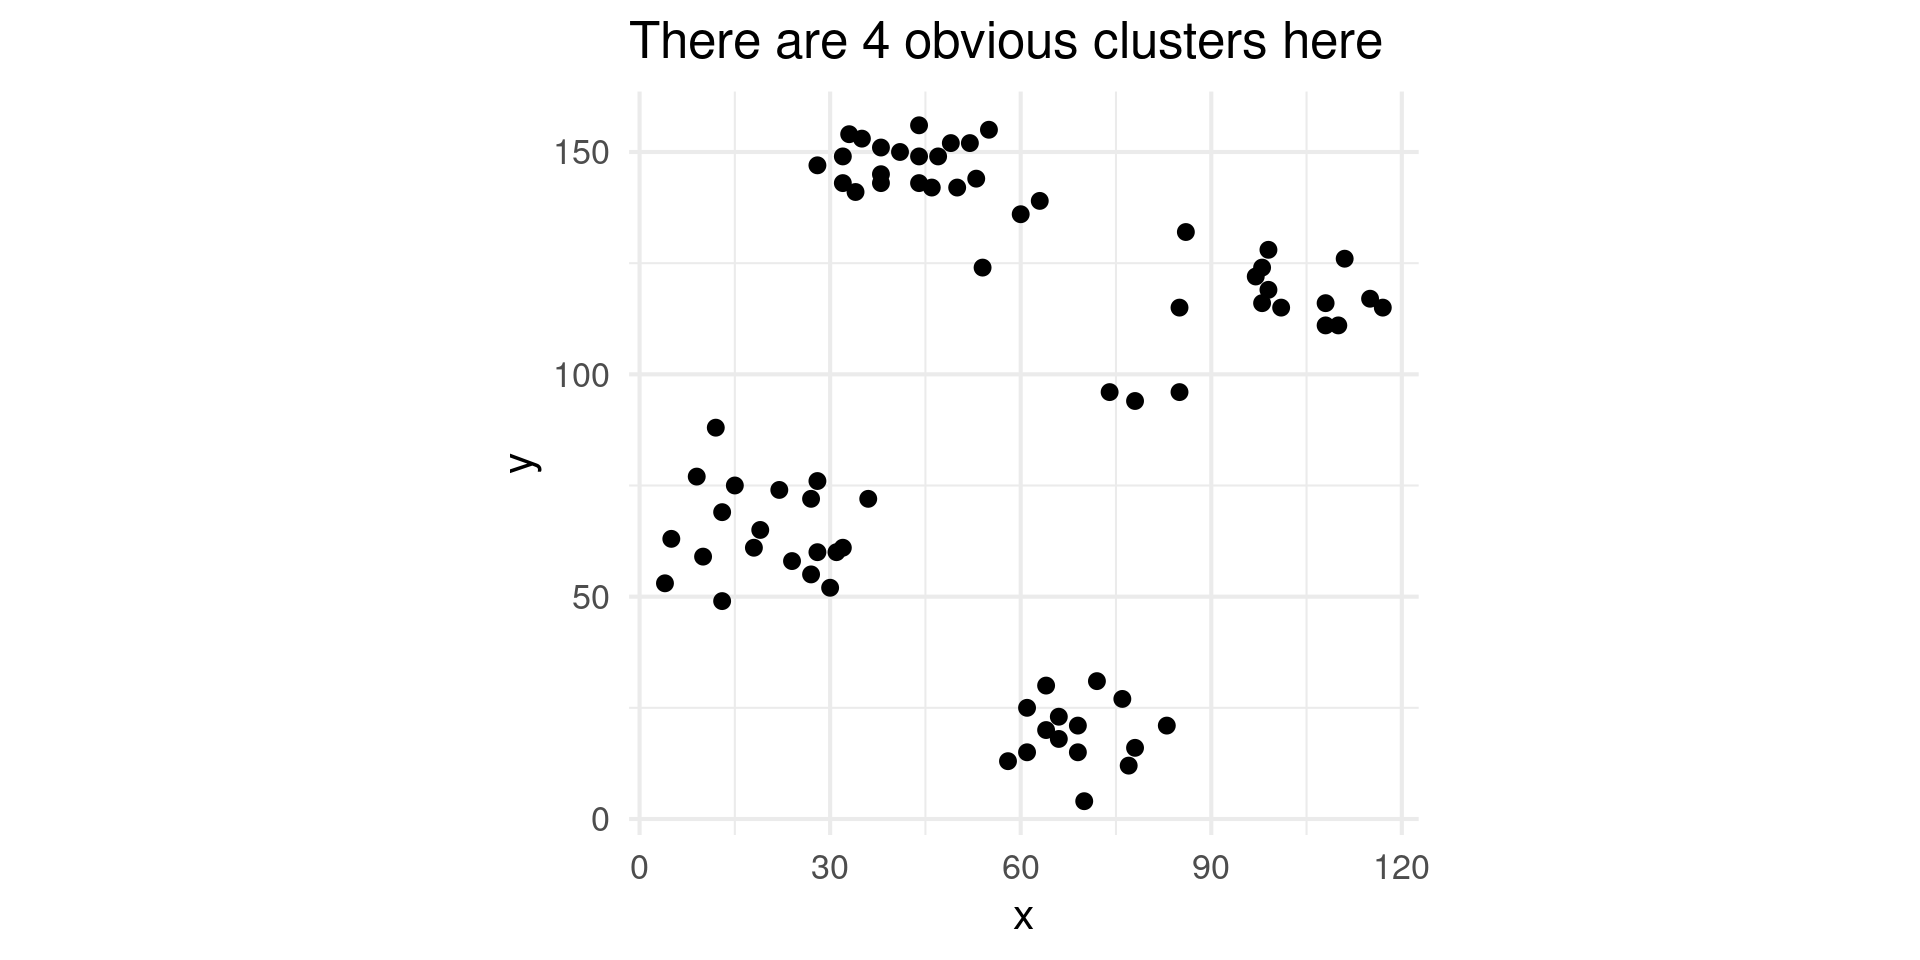
How many clusters?
- 3 Clusters
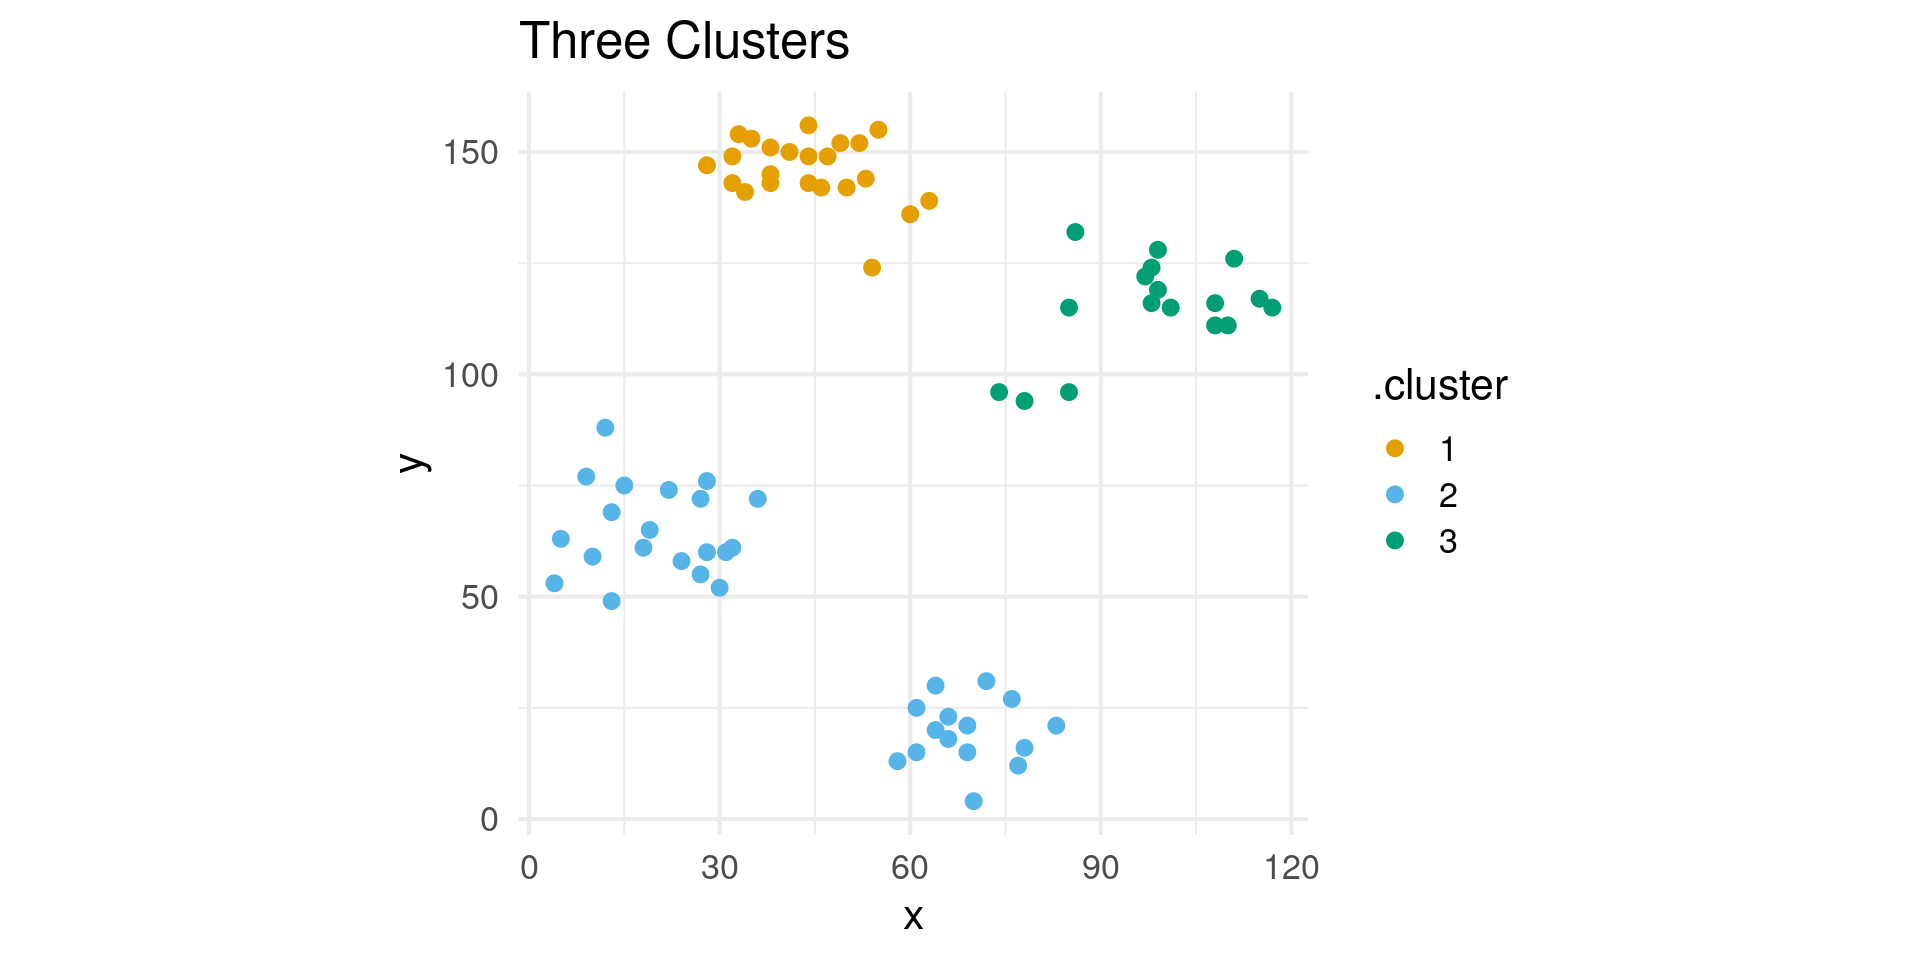
How many clusters?
- 4 Clusters
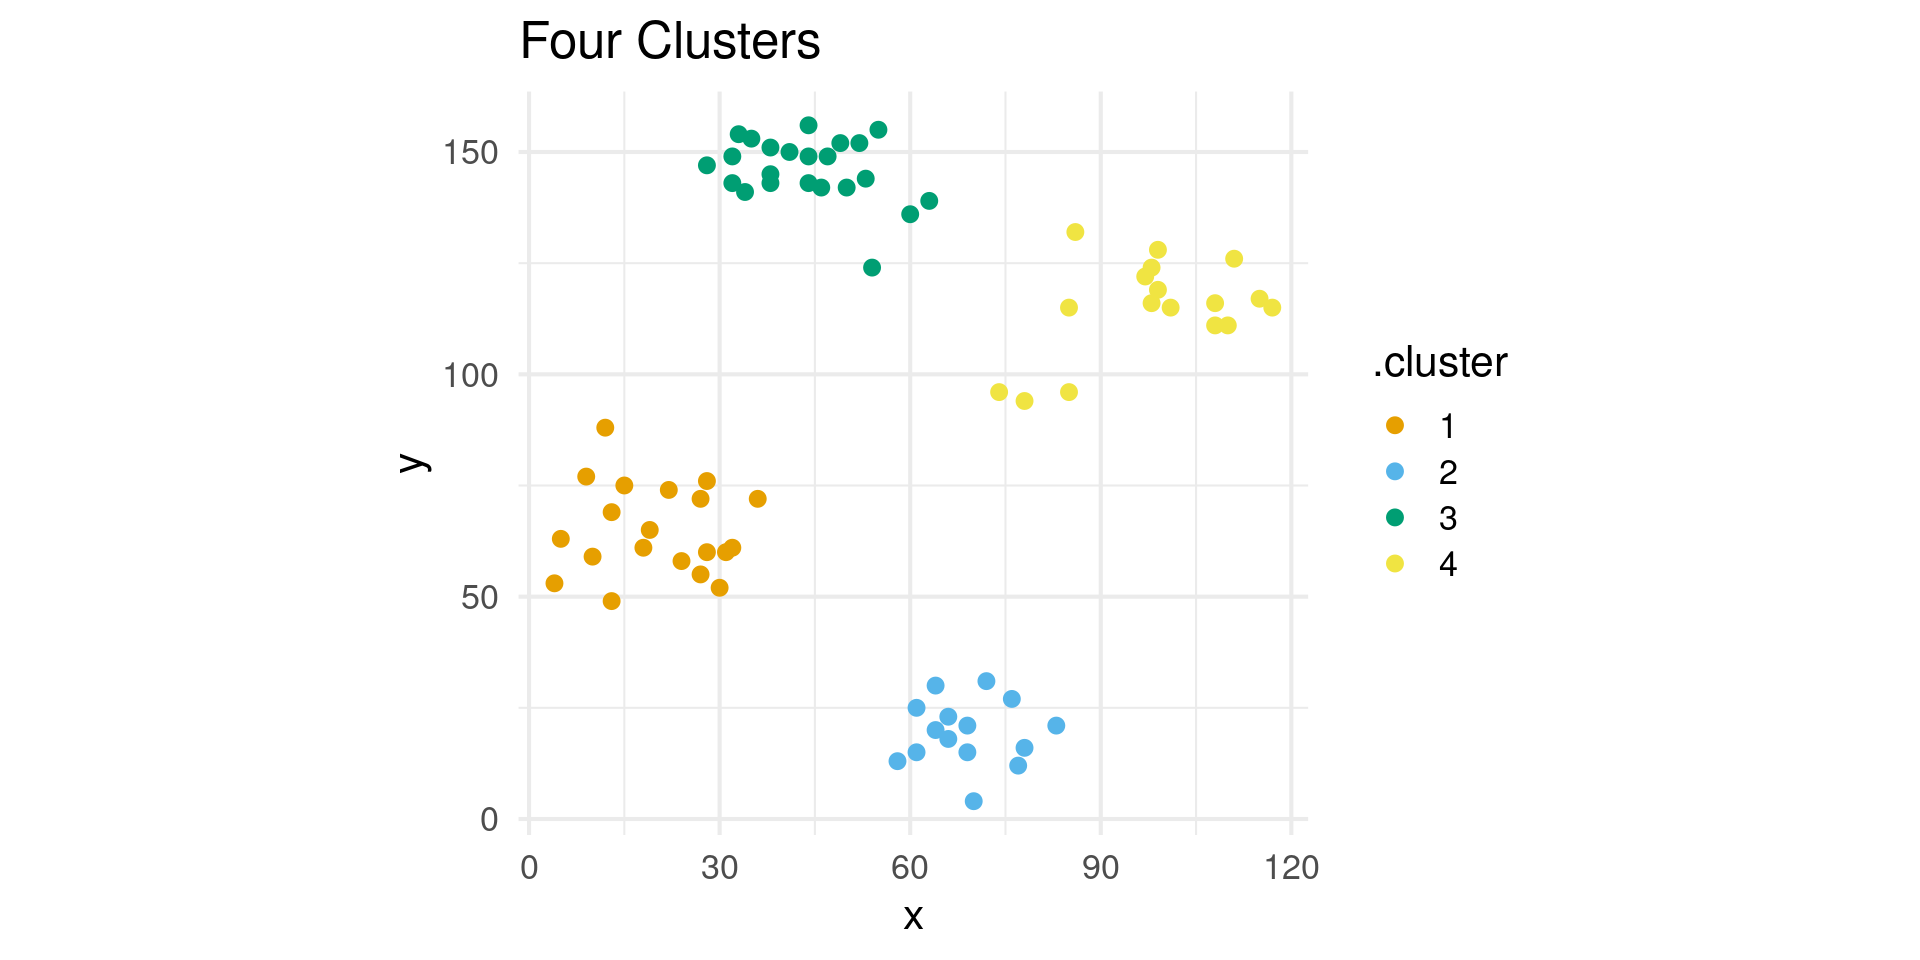
How many clusters?
- 5 Clusters
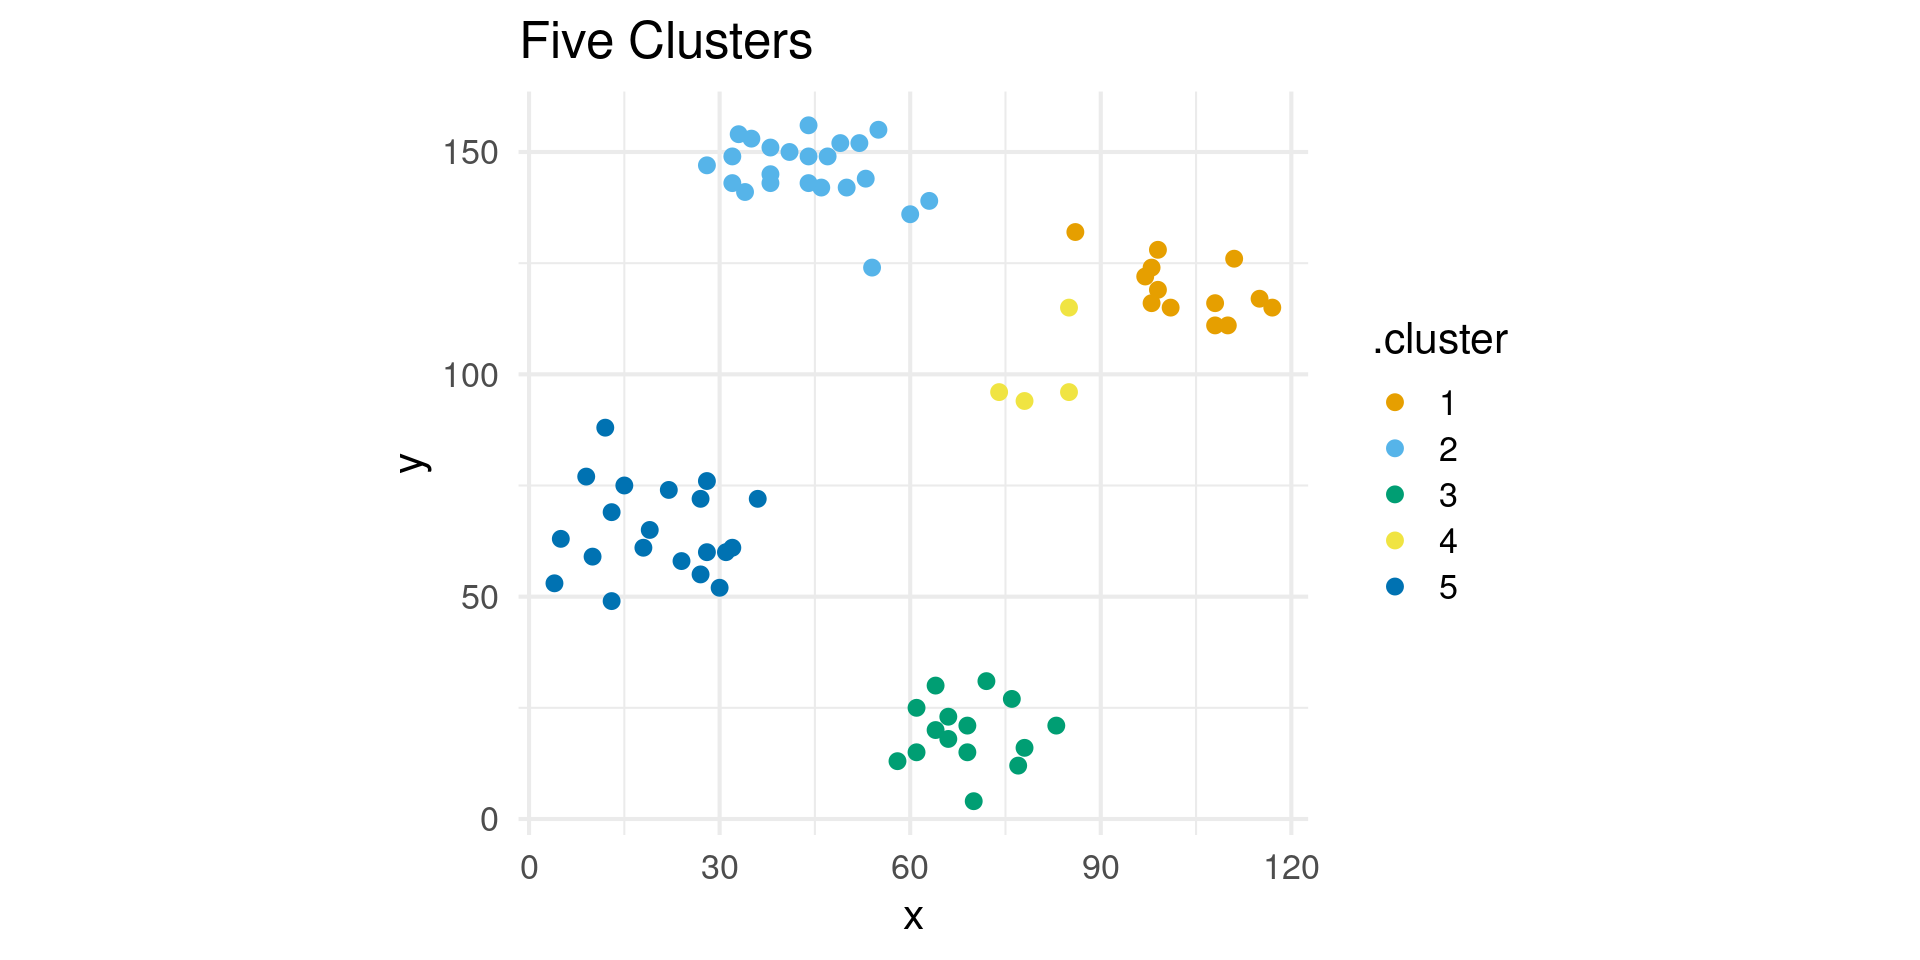
How many clusters?
- 10 Clusters
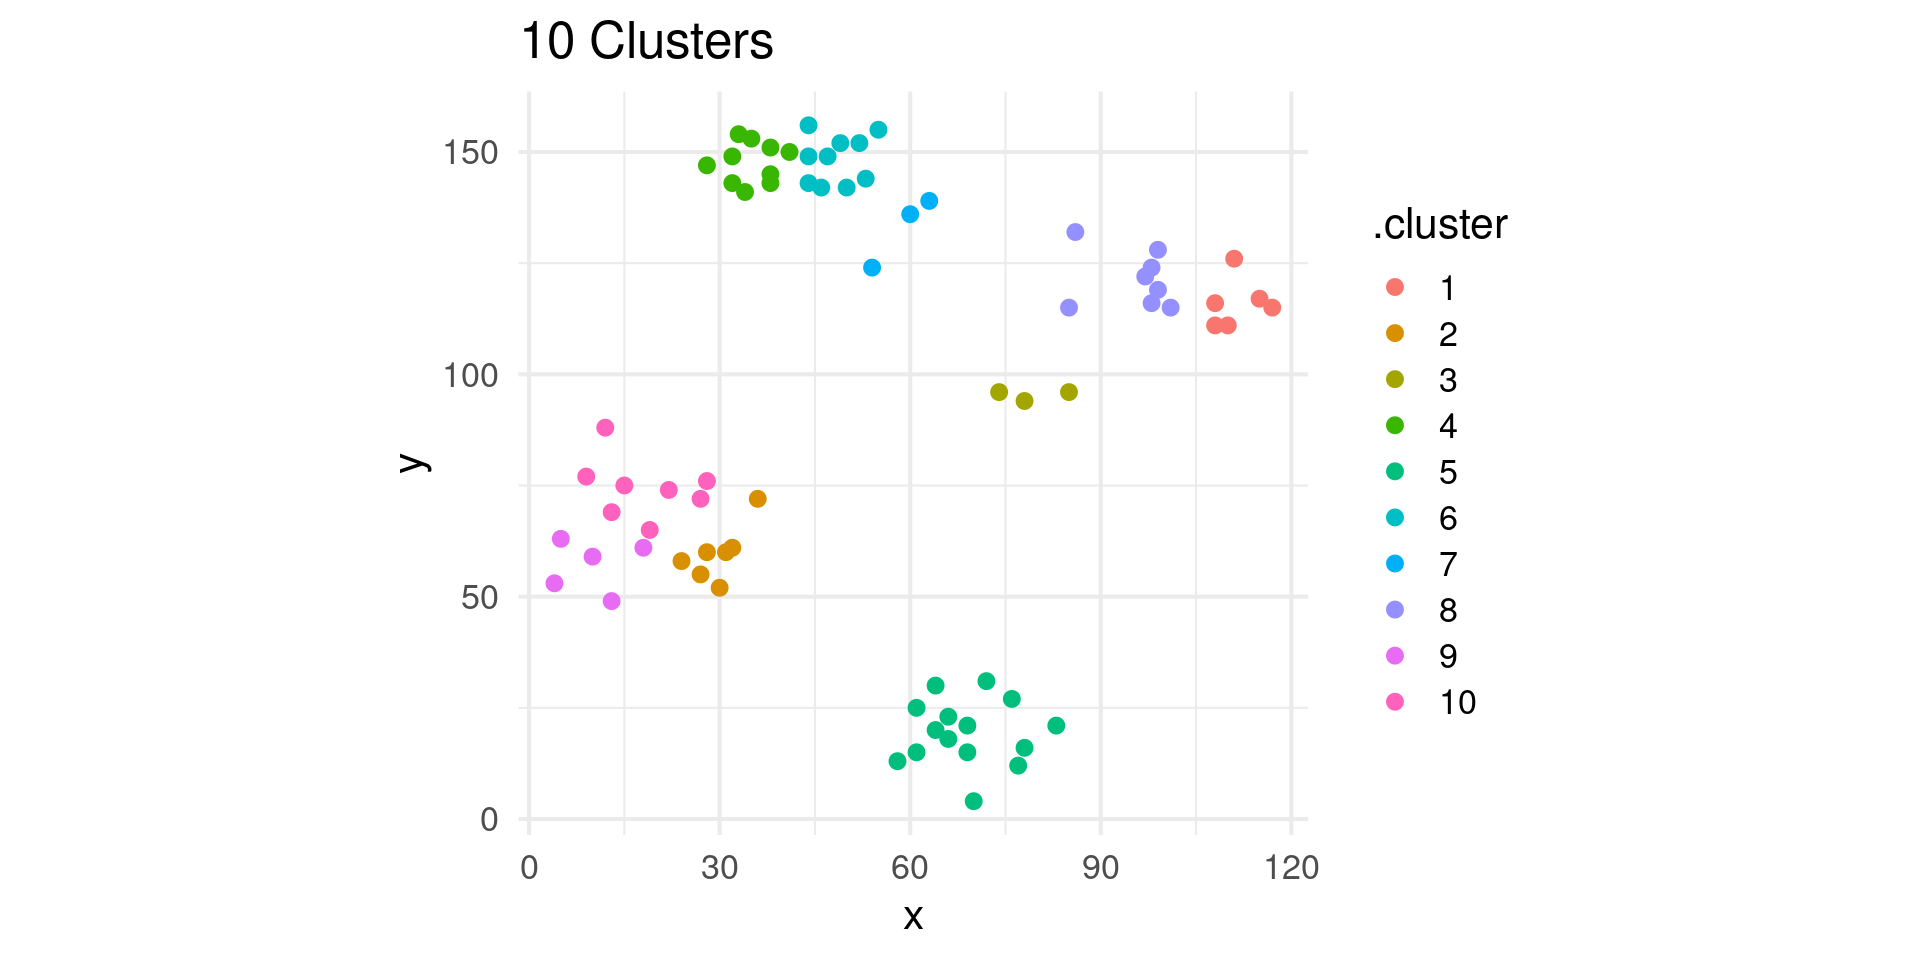
Quantitative Tools for Cluster Number
- Many methods for choosing the number of clusters!
- Elbow method: Look for
elbowin plot of within cluster variance
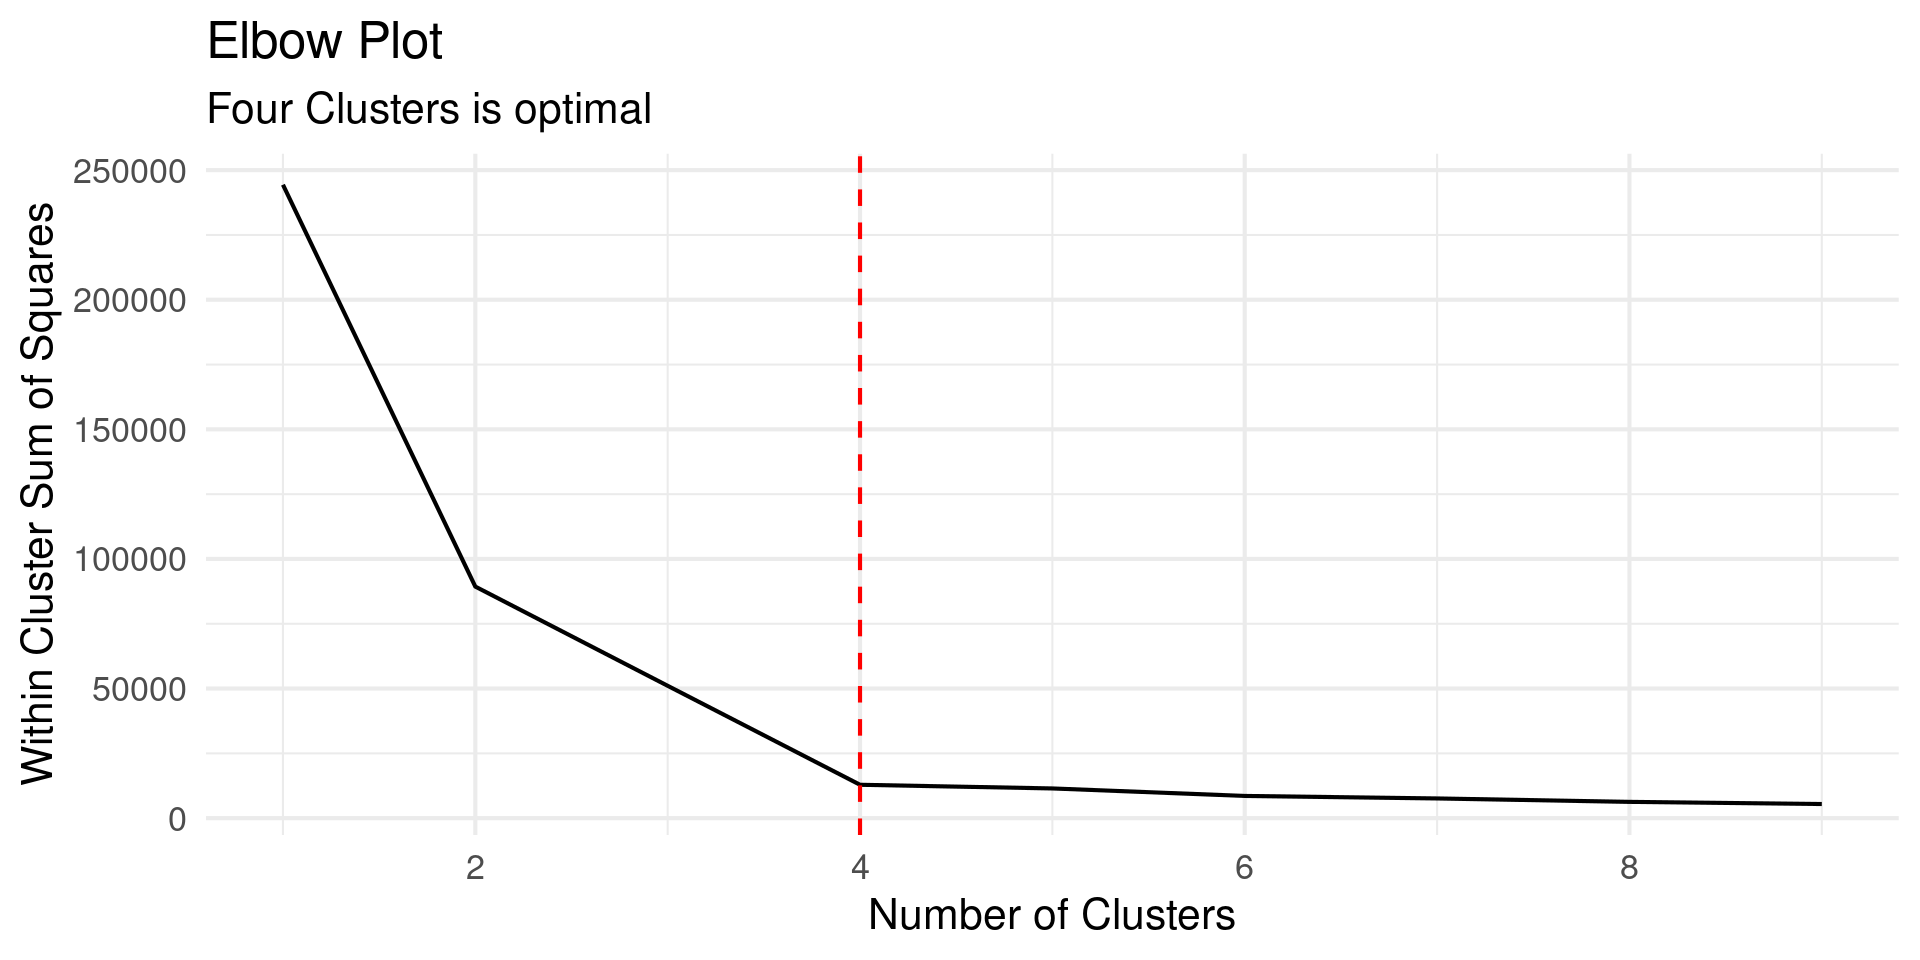
Quantitative Tools for Cluster Number
- Many methods for choosing the number of clusters!
- Elbow method: Look for
elbowin plot of within cluster variance
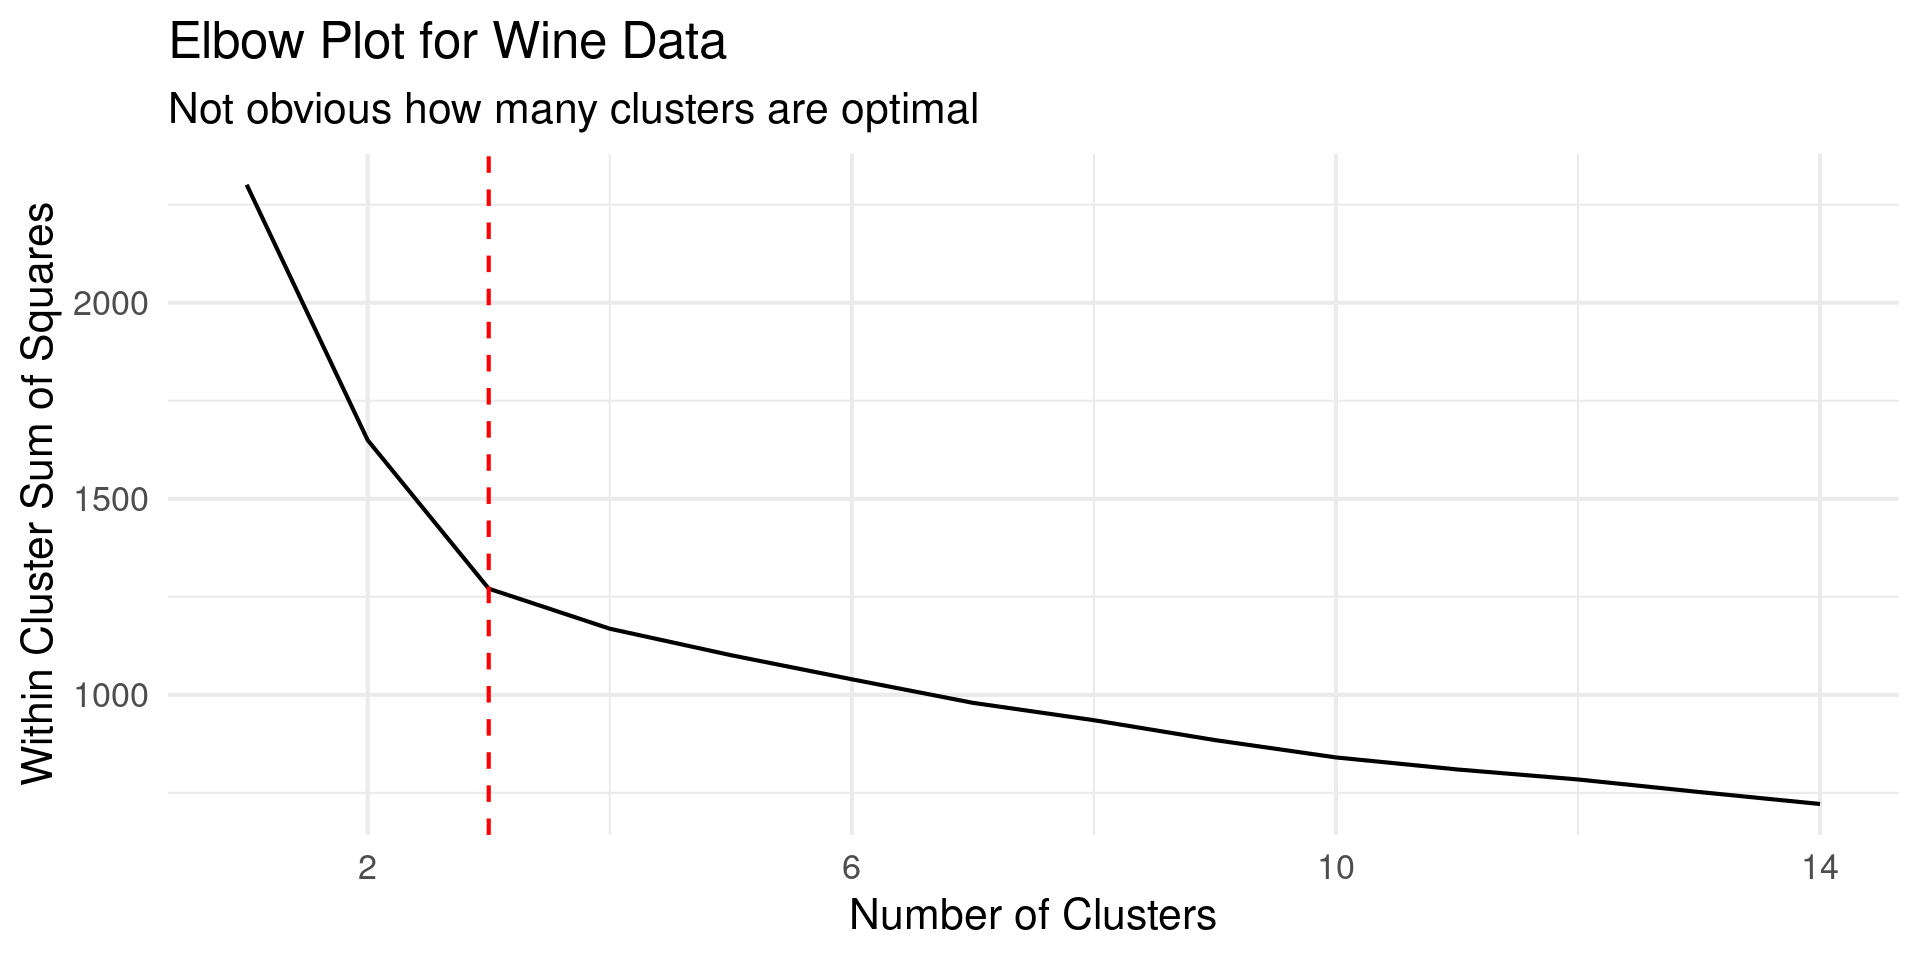
Quantitative Tools for Cluster Number
- Use
mapto apply k-means to many times
kvec = seq(2:10)

wcss = map(kvec,.f = function(k) {
    kmeans(ruspini, centers = k, nstart = 5)$tot.withinss
})
elbow_plot = tibble(clusters = kvec, wcss = wcss) |> unnest()
elbow_plot |> ggplot(aes(kvec, wcss)) +
  geom_line() +
  geom_vline(xintercept = 4, color = "red", linetype = 2) +
  theme_minimal(base_size = 16) +
  scale_x_continuous(breaks=c(2,4,6,8,10)) +
  labs(title = "Elbow Plot",
       subtitle = "Four Clusters is optimal",
       y = "Within Cluster Sum of Squares",
       x = "Number of Clusters")
Interpreting Clusters
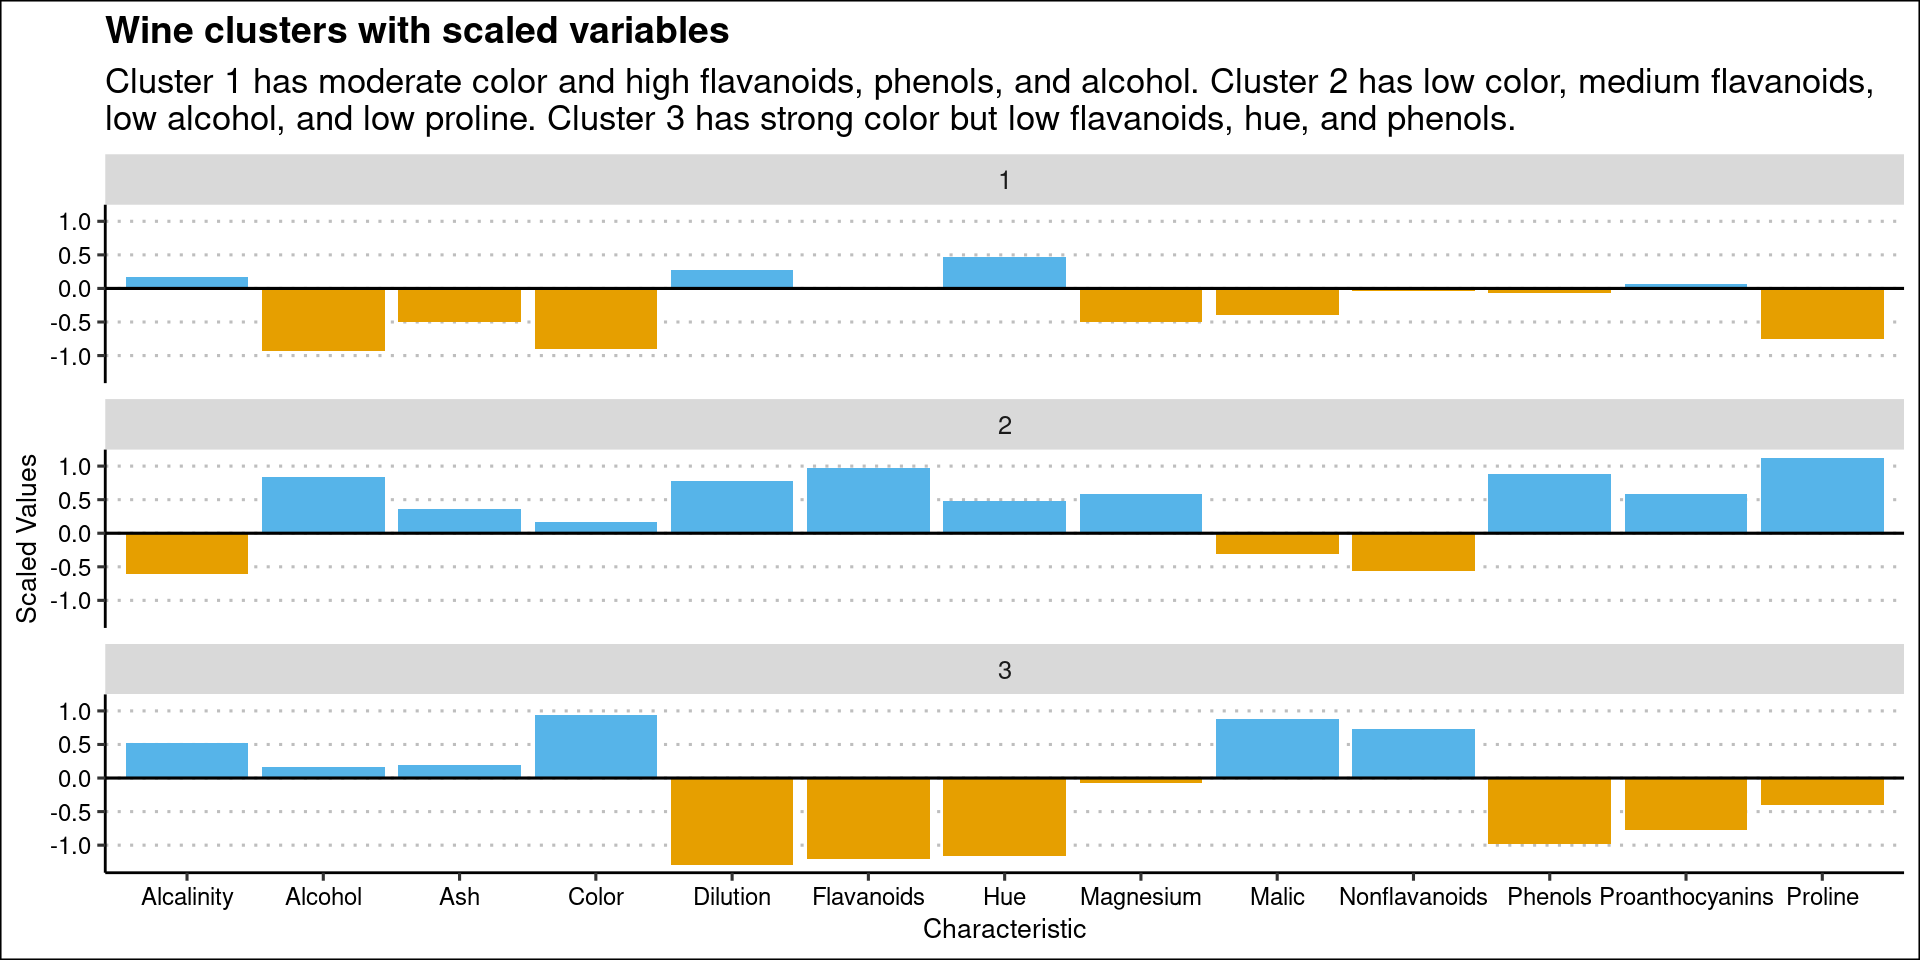
- Goal of clustering is often to gain insight.
Interpreting Clusters
- Takes some tricky to understand code to transform the PCA coordinates:
t(t(wine_clusters$centers %*% t(pca_fit$rotation)) * pca_fit$scale + pca_fit$center)coordinate transformationscaleenables visualization of variables together
Interpreting Clusters
- There could be many ways of visualizing this
- Here chose column plot, colored by sign with a horizontal line to denote where 0 is across the facets
- I found this a little better than a dot plot for some reason
Annotating Clusters
geom_mark_ellipseto draw circles around clusters
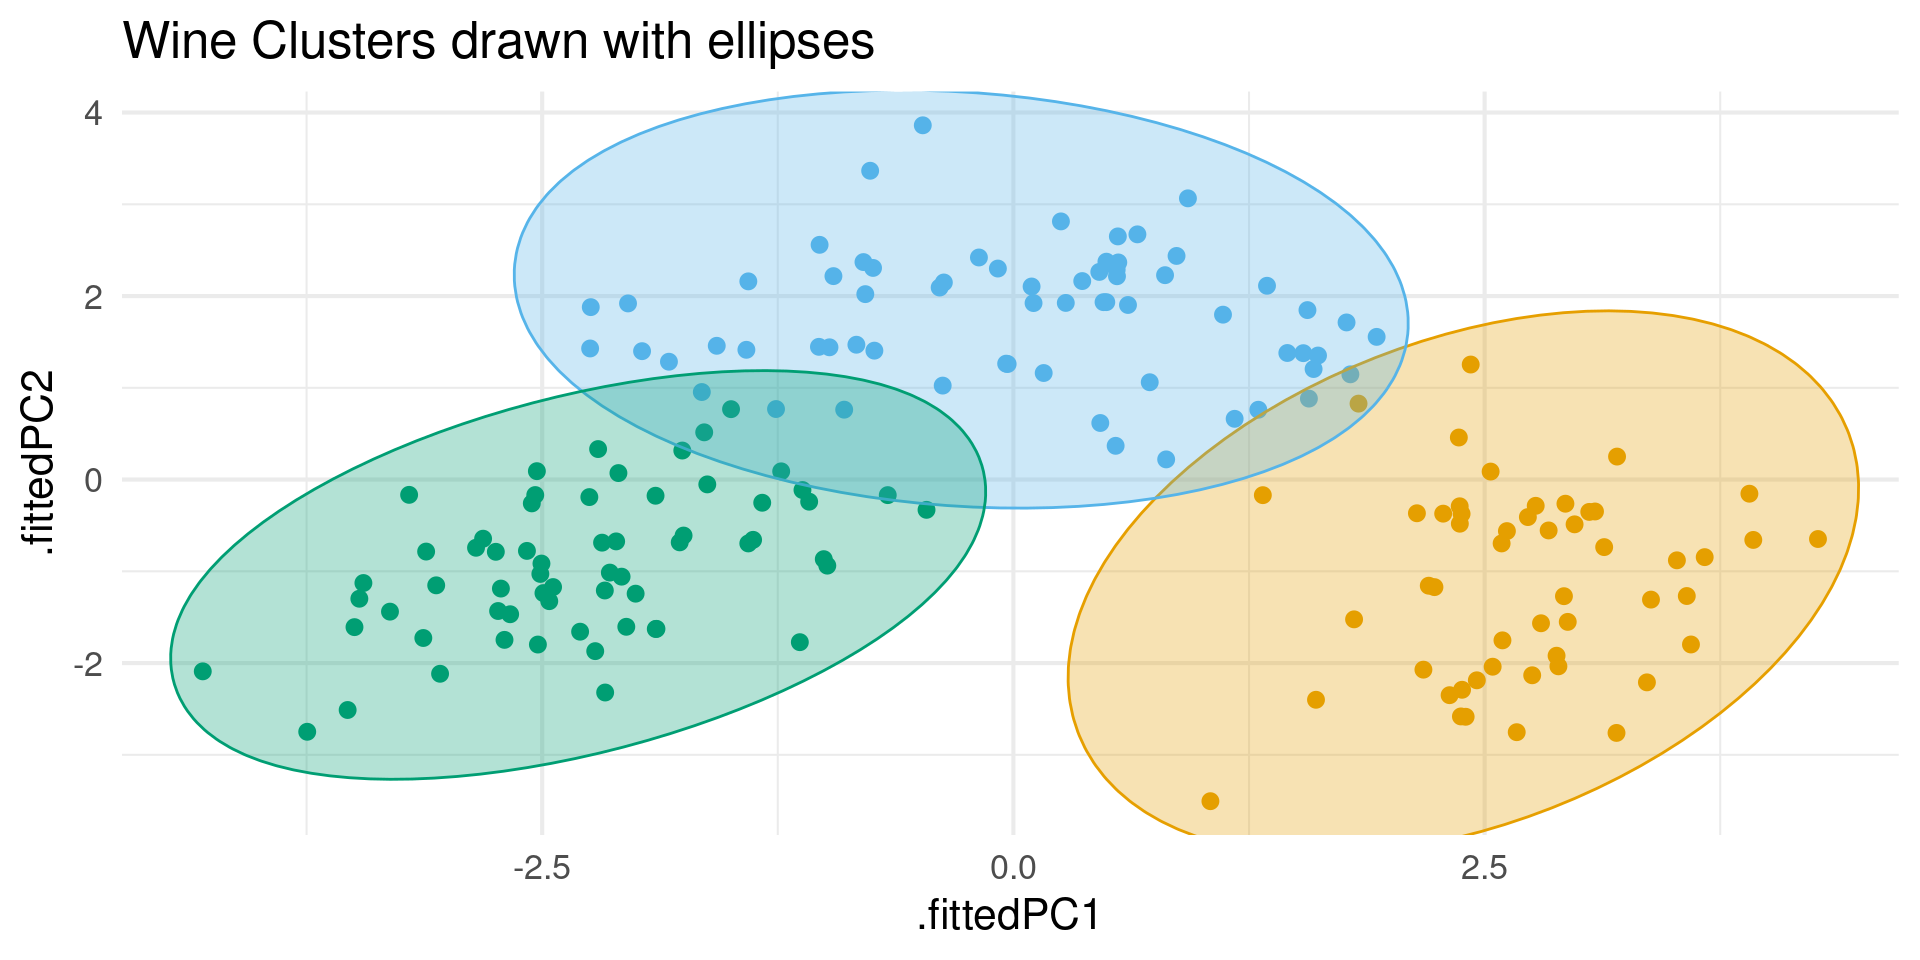
k-means tips and pitfalls
- Algorithm not guaranteed to converge
- Can get wrong answes if
nstarttoo low - Can get stuck in local minima
- Can get wrong answes if
- Very sensitive to outliers and largest scale of data
- Always scale data first or used on scaled coordinates
- Assumes Spherical, Balanced Clusters
- Will find clusters when there are none
Other Clustering Algorithms
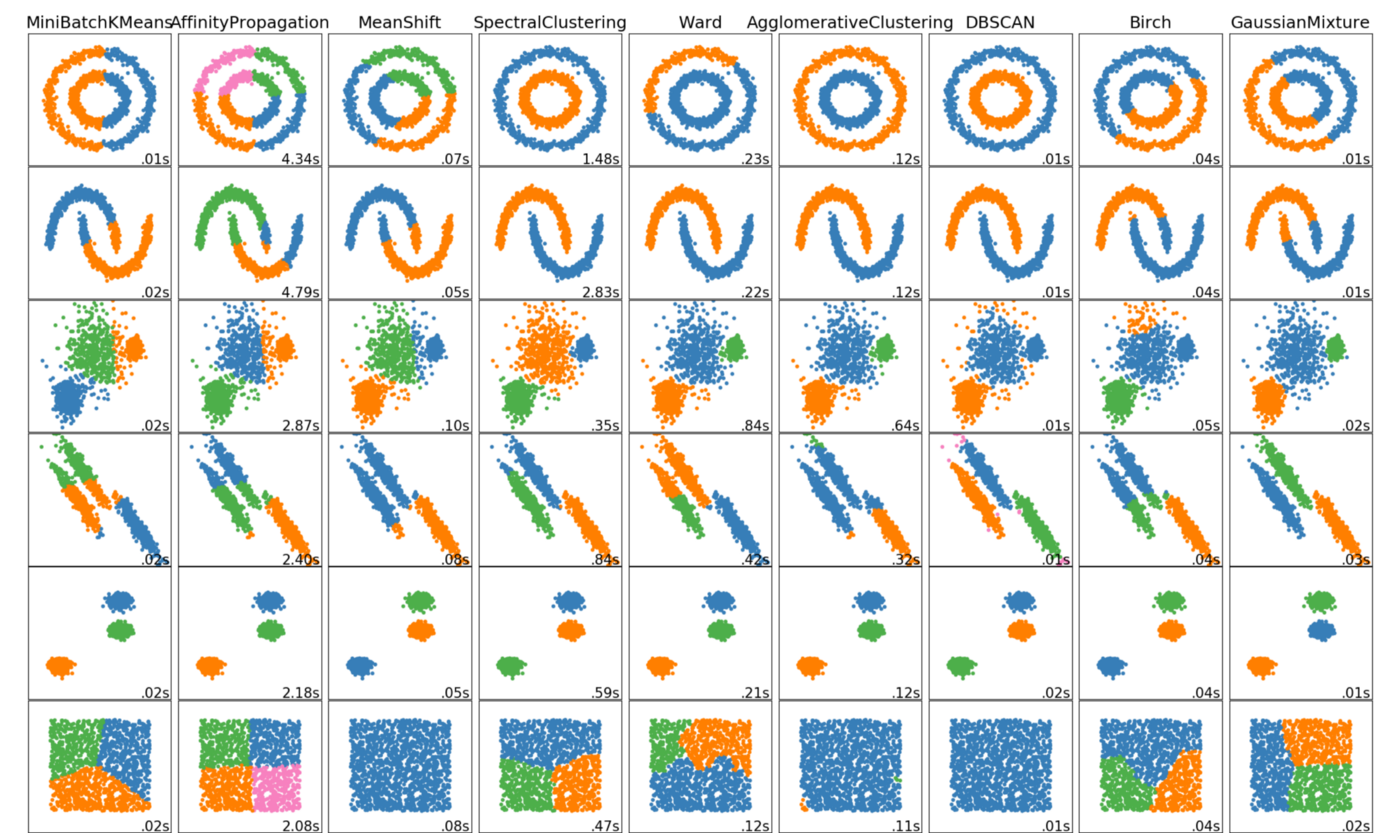
George Seif