Meetup 2: Graphical Perception Theory
2026-09-07
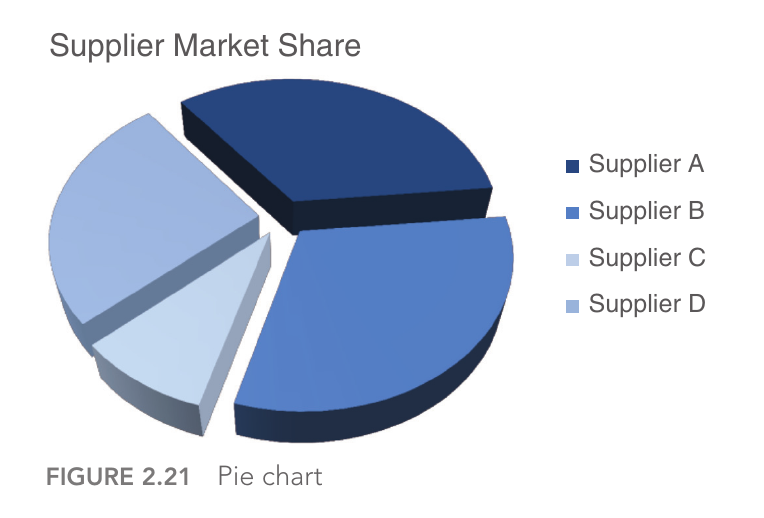
Why Are Pie-Charts Terrible?
- “Pie Charts are Evil”
- Chapter 2 Storytelling with Data
![]()
- Chapter 2 Storytelling with Data
Why Are Pie-Charts Terrible?
- Lots of graphics advice is presented as rules
- Are there principles behind these rules?
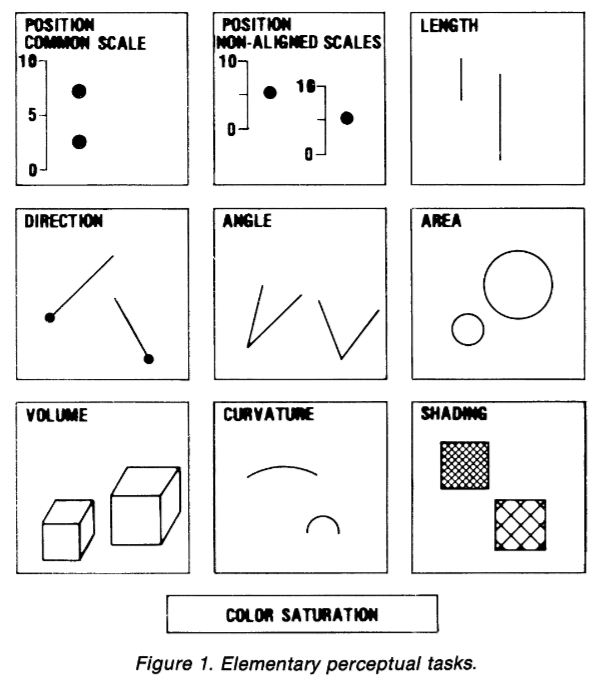
Elementary Perceptual Tasks
- Position along a common scale
- Position along non-aligned scales
- Length
- Direction
- Angle
- Area
- Volume
- Curvature
- Shading
- Hue/Saturation
Elementary Perceptual Tasks
- Position along a common scale
- Position along non-aligned scales
- Length
- Direction
- Angle
- Area
- Volume
- Curvature
- Shading
- Hue/Saturation
Elementary Perceptual Tasks
- Position along a common scale
- Position along non-aligned scales
- Length
- Direction
- Angle
- Area
- Volume
- Curvature
- Shading
- Hue/Saturation
Elementary Perceptual Tasks
- Position along a common scale
- Position along non-aligned scales
- Length
- Direction
- Angle
- Area
- Volume
- Curvature
- Shading
- Hue/Saturation
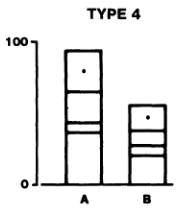
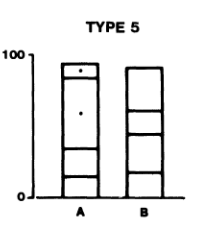
Elementary Perceptual Tasks
- Position along a common scale
- Position along non-aligned scales
- Length
- Direction
- Angle
- Area
- Volume
- Curvature
- Shading
- Hue/Saturation
Elementary Perceptual Tasks
- Position along a common scale
- Position along non-aligned scales
- Length
- Direction
- Angle
- Area
- Volume
- Curvature
- Shading
- Hue/Saturation
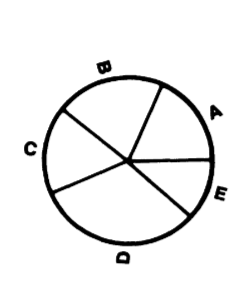
Elementary Perceptual Tasks
- Position along a common scale
- Position along non-aligned scales
- Length
- Direction
- Angle
- Area
- Volume
- Curvature
- Shading
- Hue/Saturation
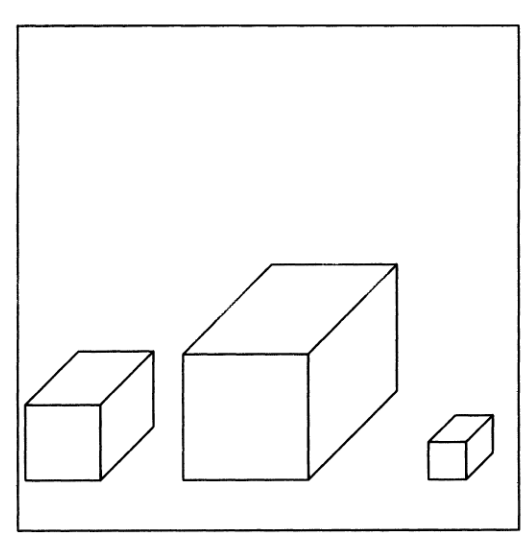
Elementary Perceptual Tasks
- Position along a common scale
- Position along non-aligned scales
- Length
- Direction
- Angle
- Area
- Volume
- Curvature
- Shading
- Hue/Saturation
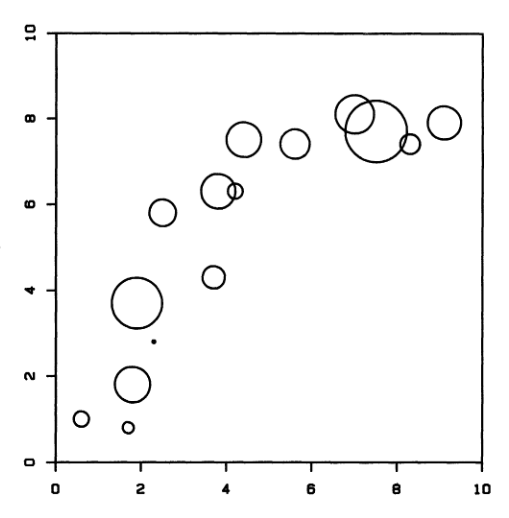
Elementary Perceptual Tasks
- Position along a common scale
- Position along non-aligned scales
- Length
- Direction
- Angle
- Area
- Volume
- Curvature
- Shading
- Hue/Saturation
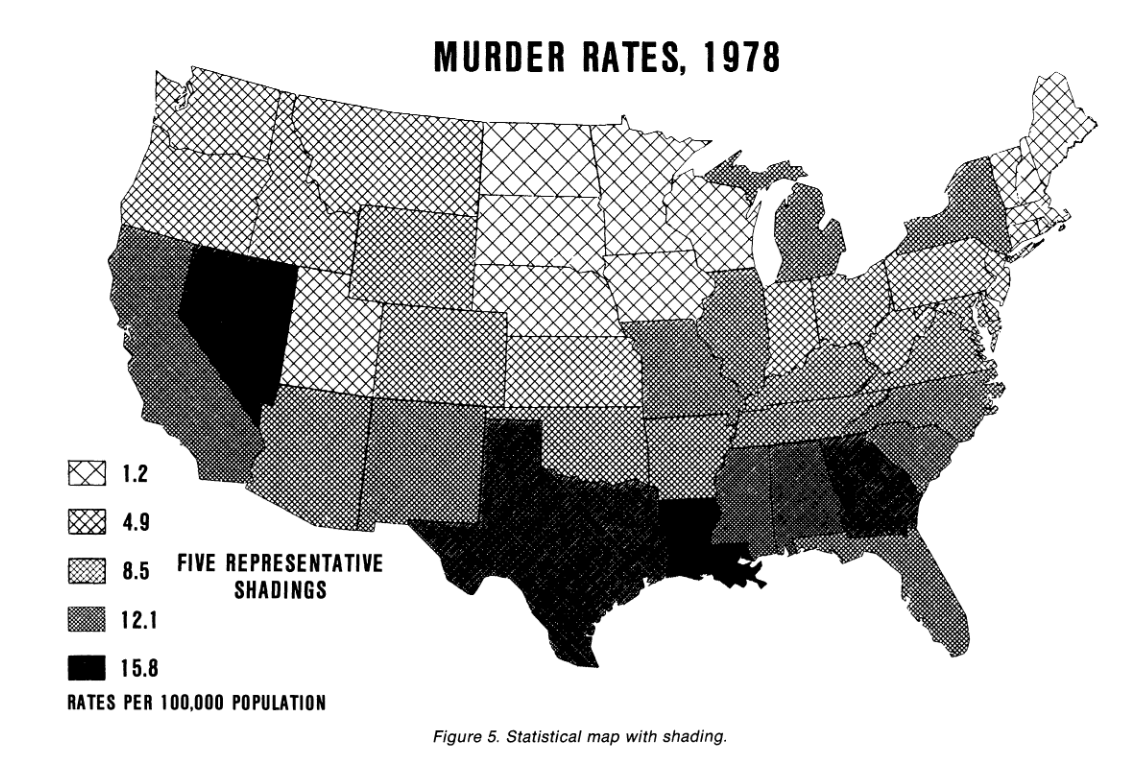
Elementary Perceptual Tasks
- Position along a common scale
- Position along non-aligned scales
- Length
- Direction
- Angle
- Area
- Volume
- Curvature
- Shading
- Hue/Saturation
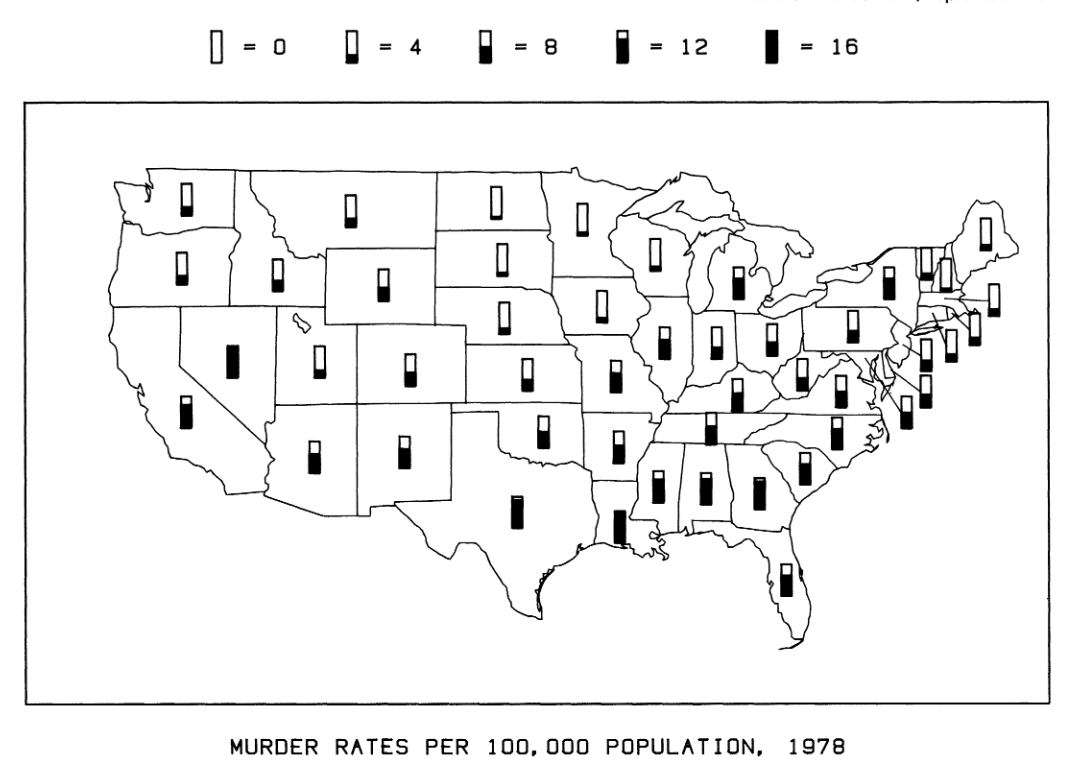
Elementary Perceptual Tasks
- Position along a common scale
- Position along non-aligned scales
- Length
- Direction
- Angle
- Area
- Volume
- Curvature
- Shading
- Hue/Saturation
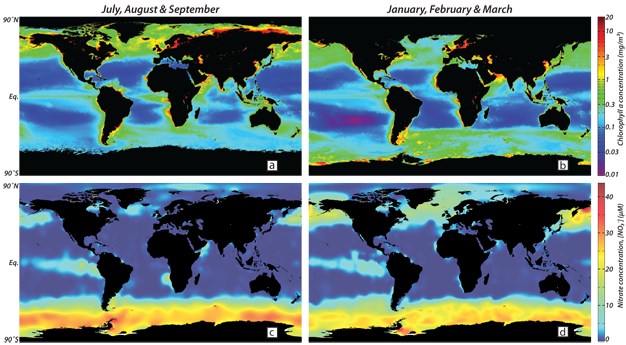
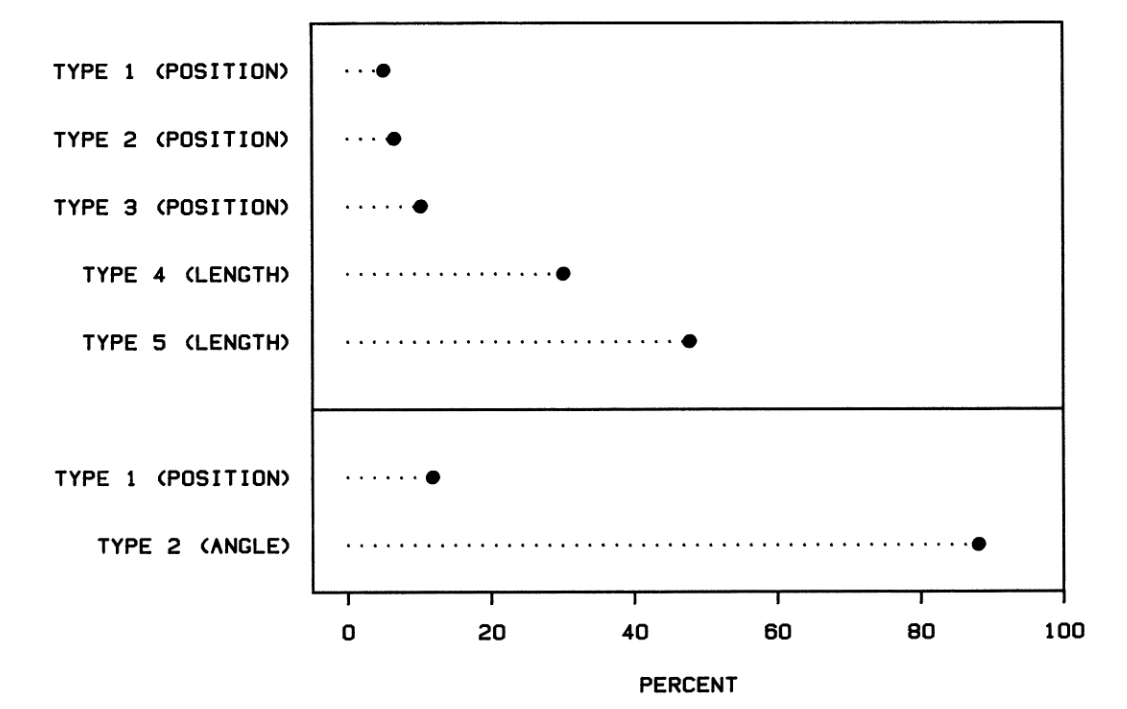
Some Perceptual Tasks are Easier
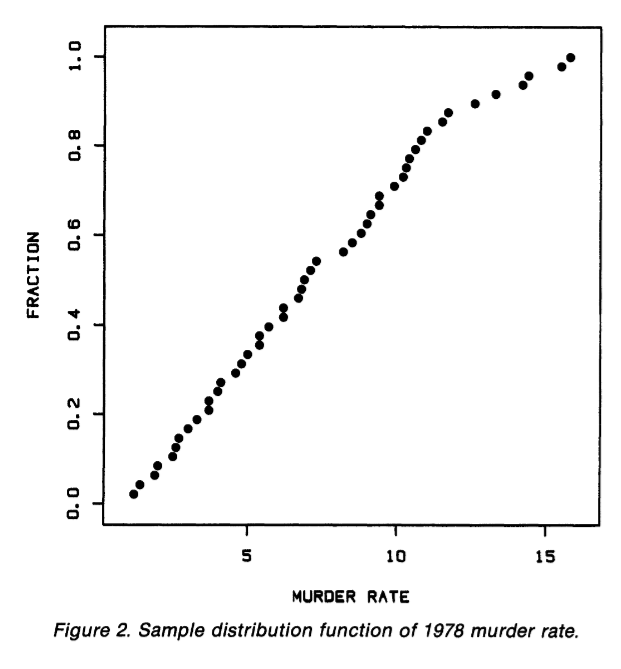
- Position along a common axis is the best
- Percentage of major errors:
![]()
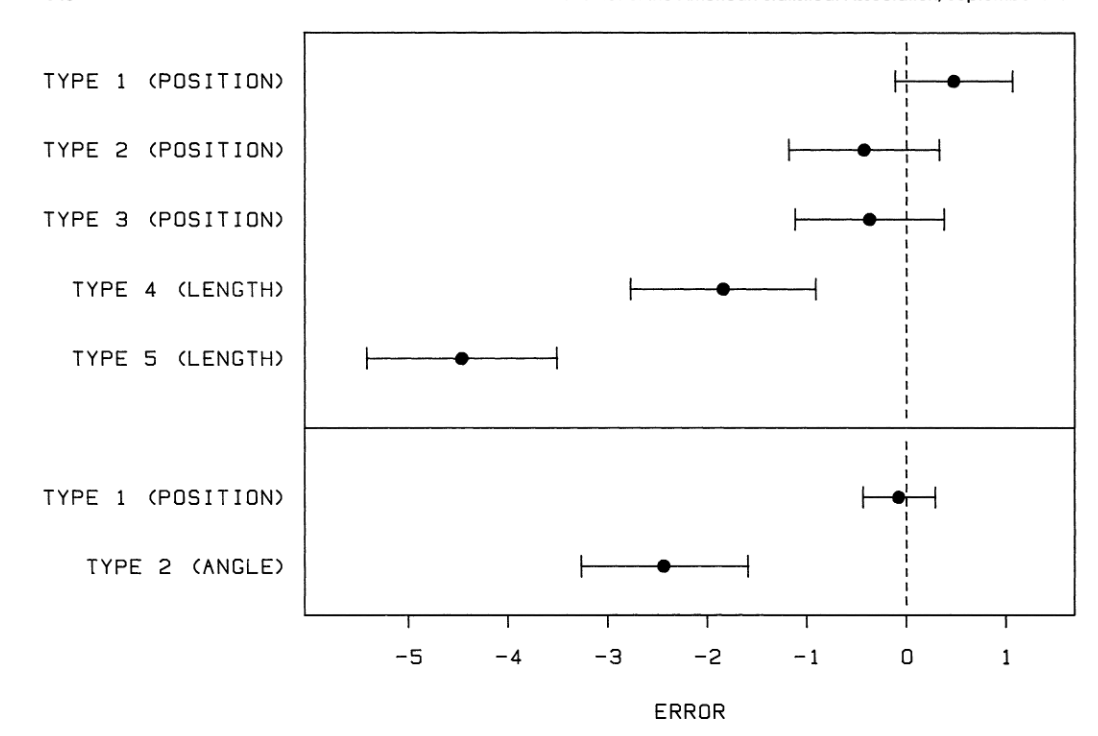
Some Perceptual Tasks are Easier
- Position along a common axis is the best
- Error
![]()
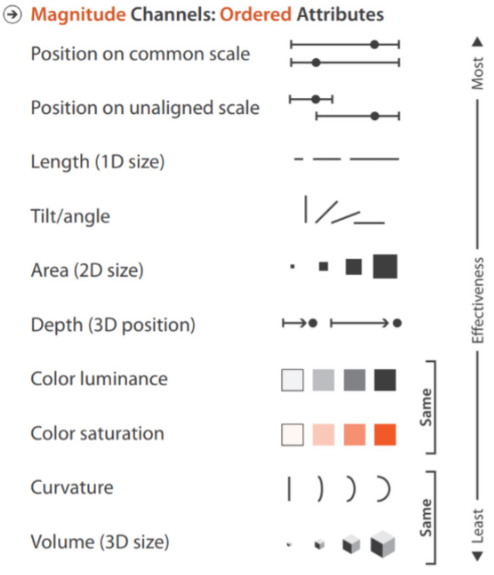
Overall Ranking
- Position along a common axis
- Position along an uncommon axis
- Length, Direction, Angle
- Area
- Shading, Color Saturation
- Volume, Curvature
Dot-Plots for 1D Comparisons
- Flights from each carrier leaving NYC in 2013
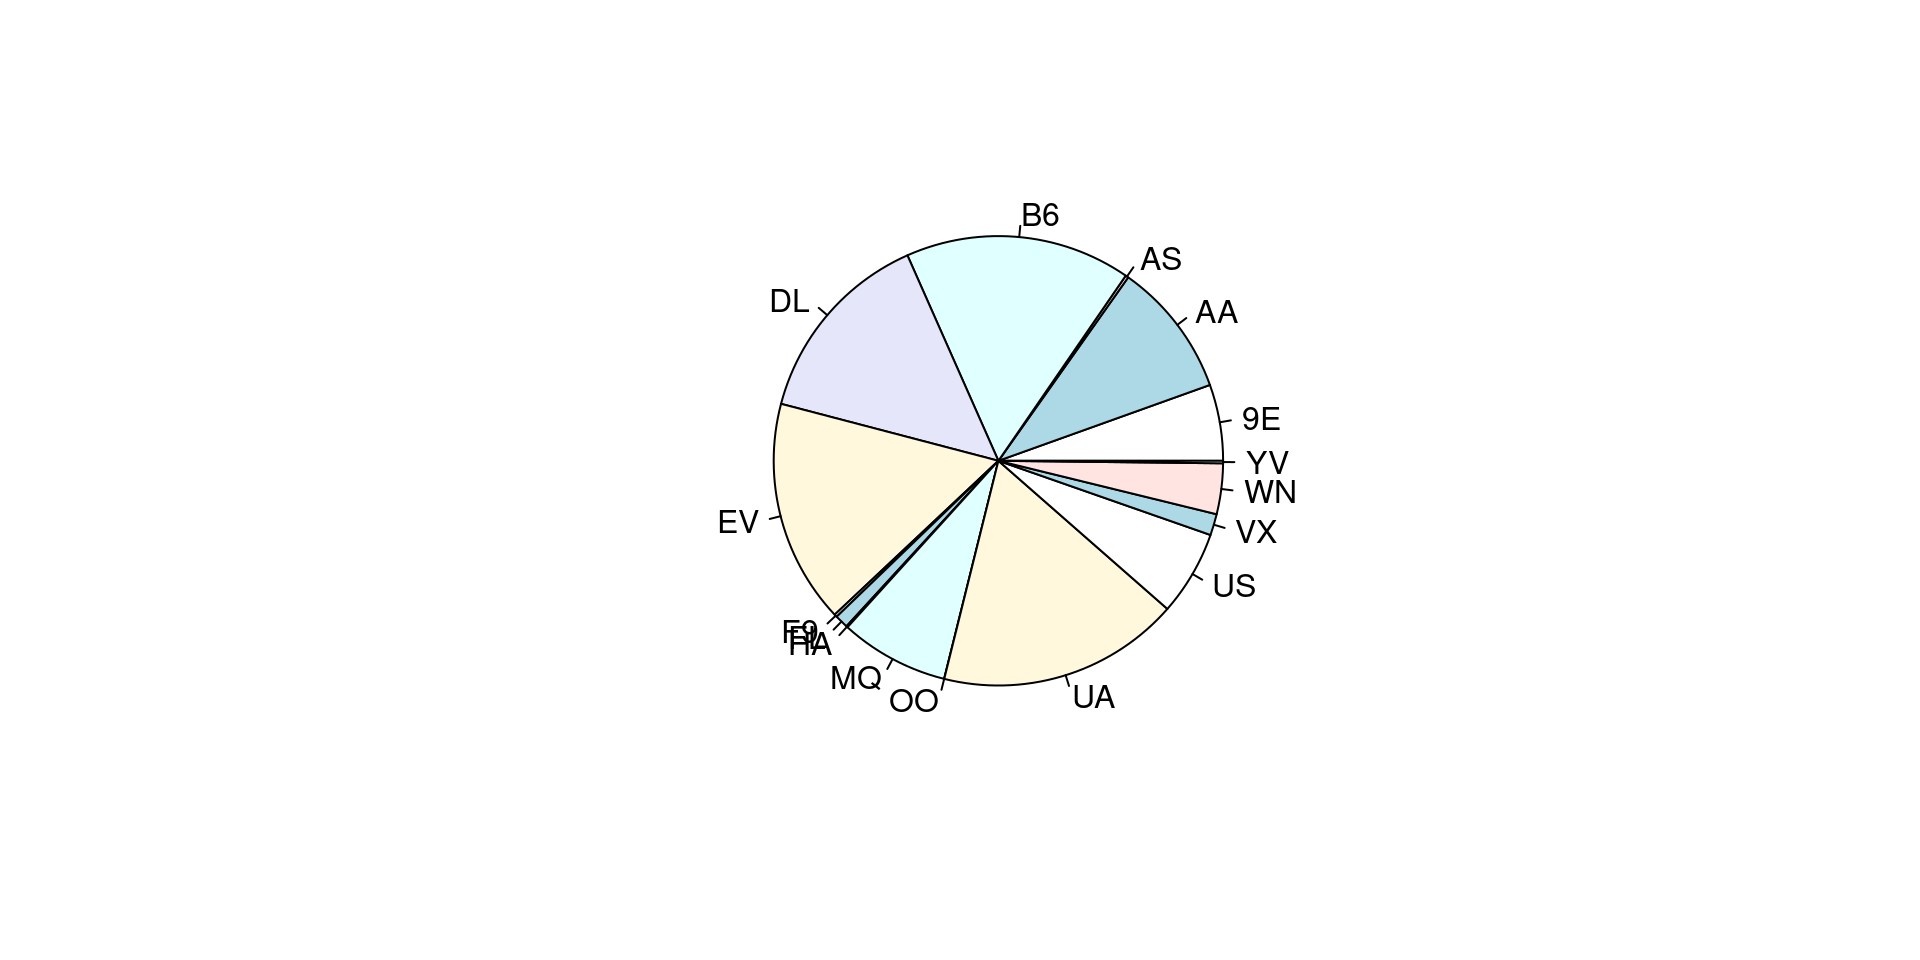
Dot-Plots for Comparisons
- Flights from each carrier leaving NYC in 2013
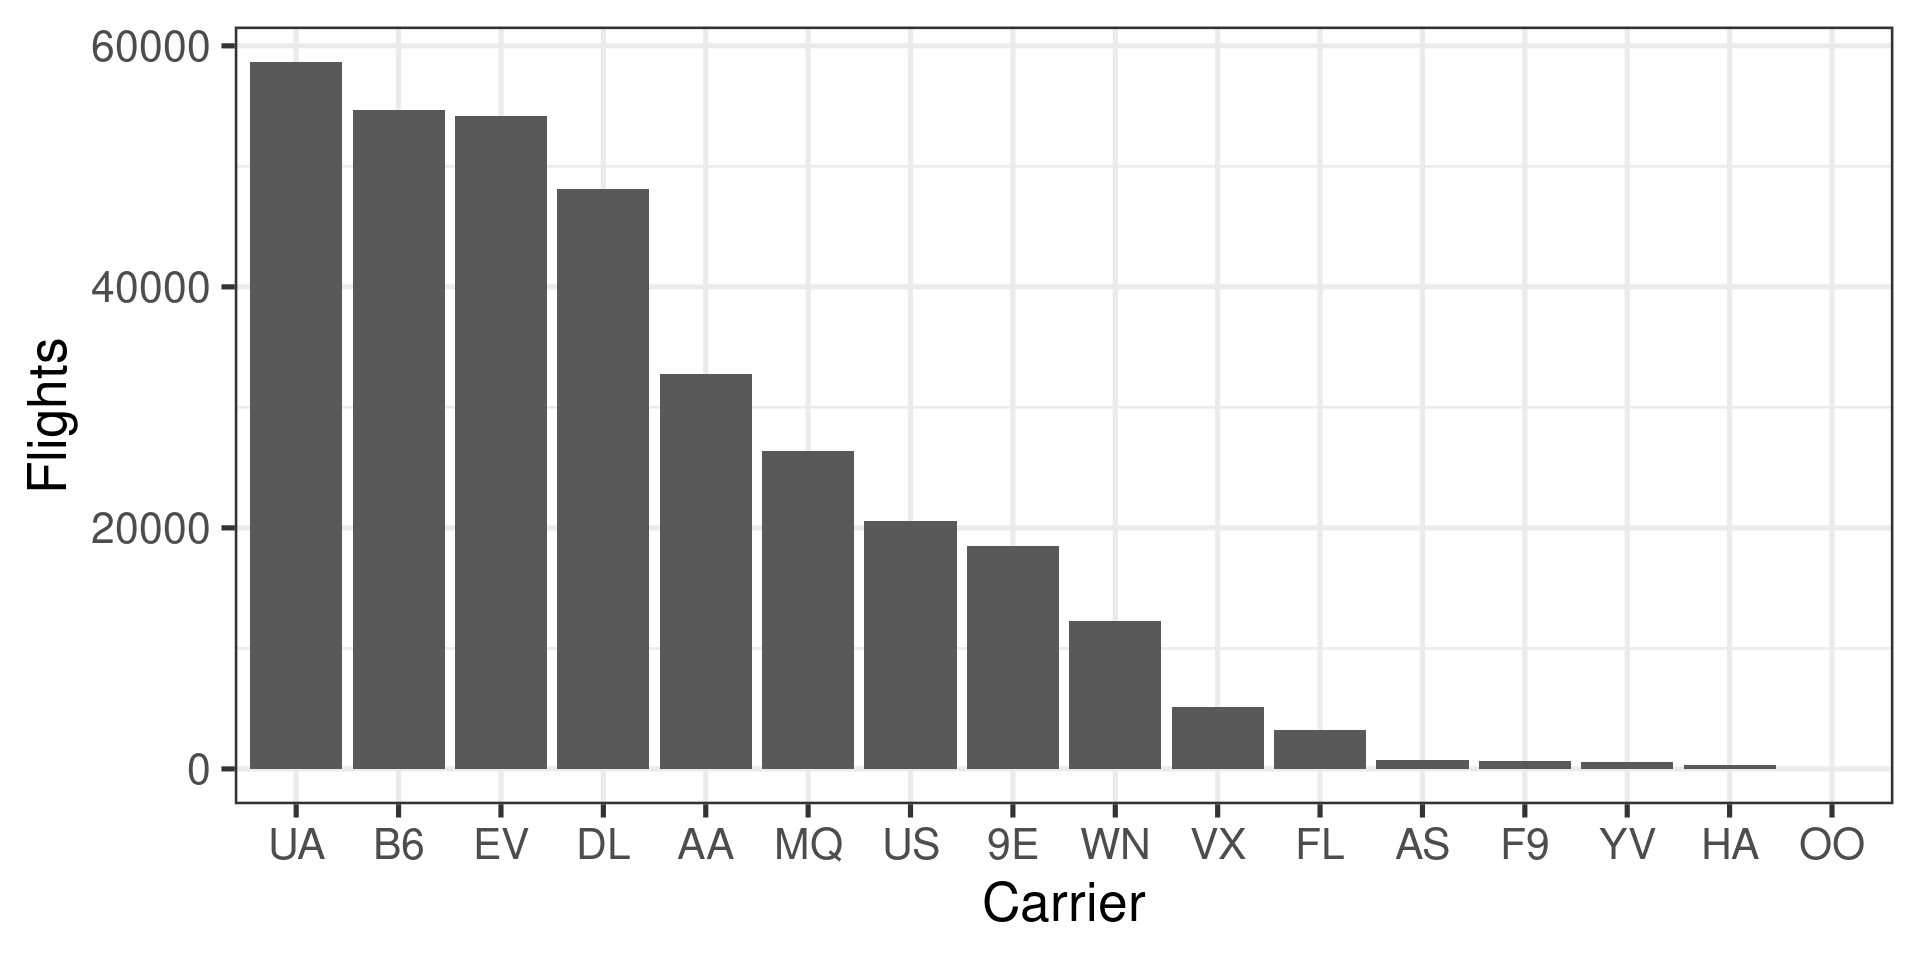
Dot-Plots for Comparisons
- Flights from each carrier leaving NYC in 2013
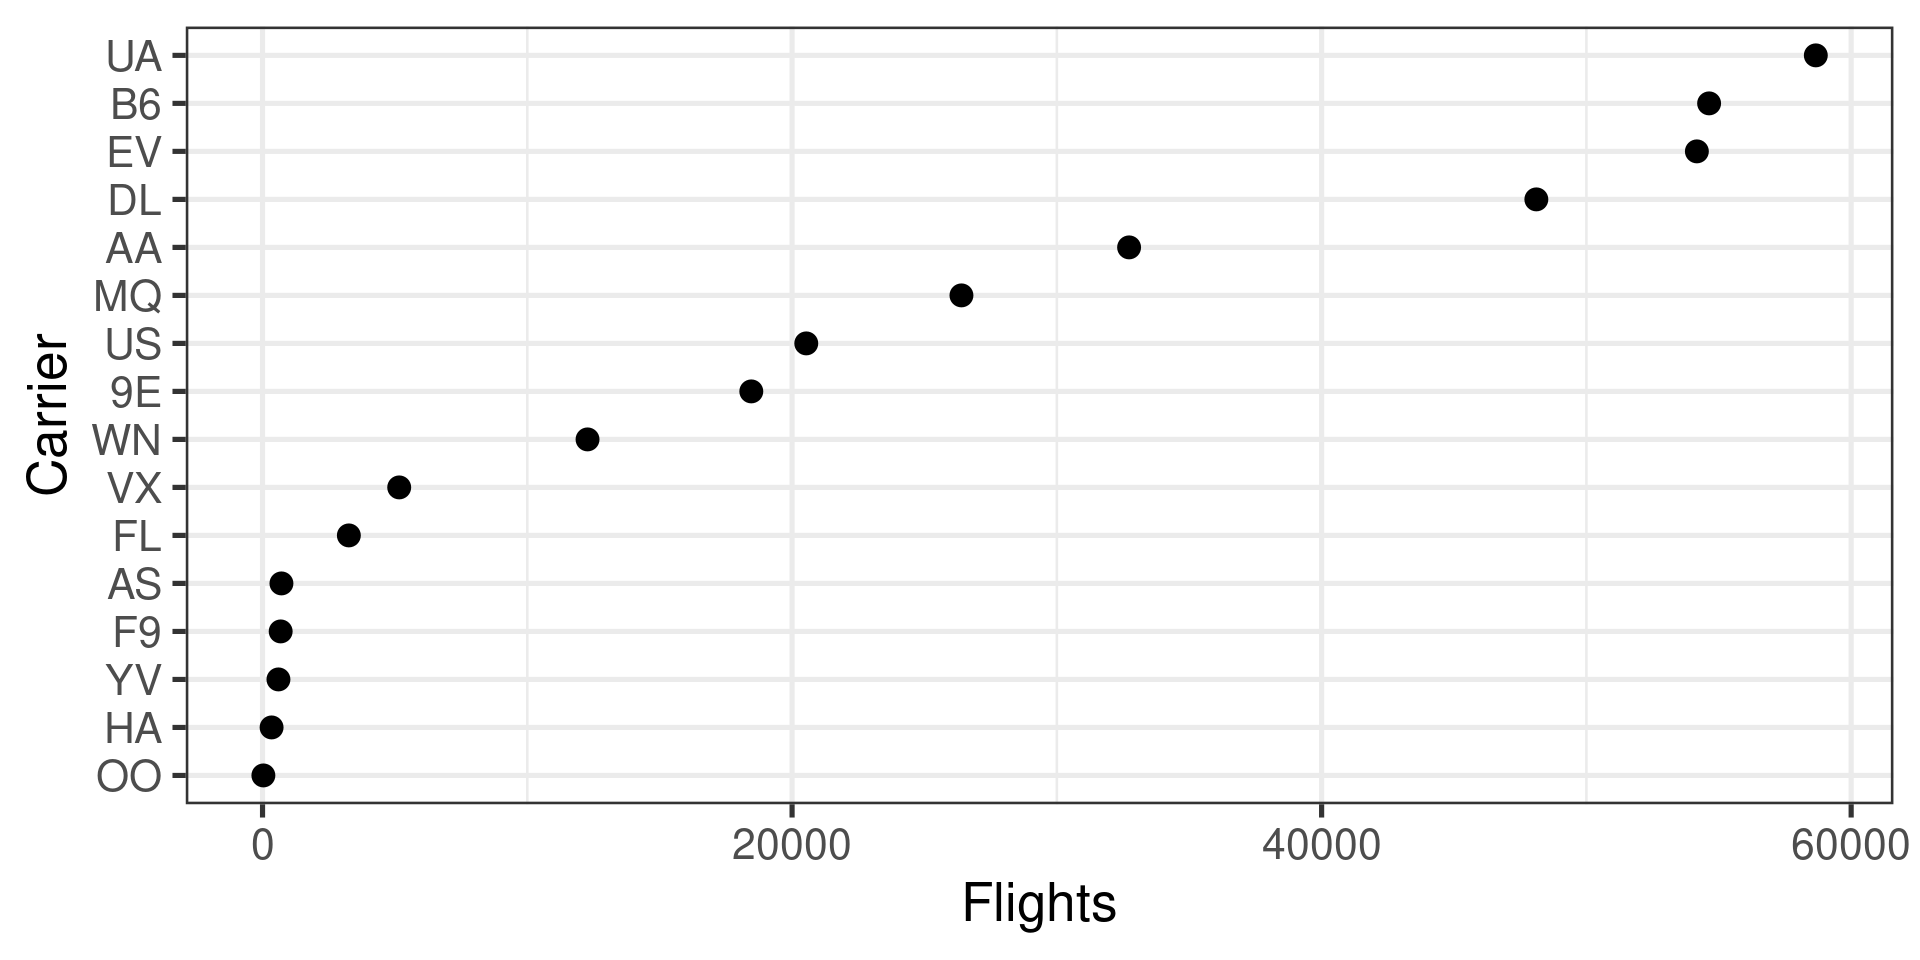
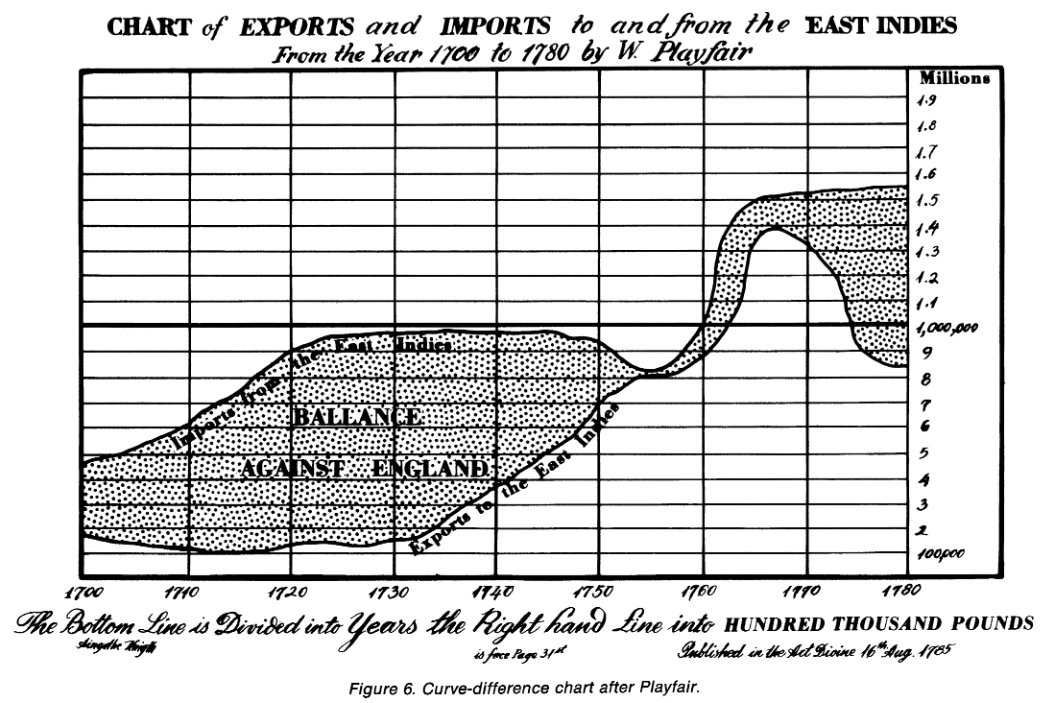
Show Differences Directly
- Position is much easier to judge than length
![Robbins 2004]()
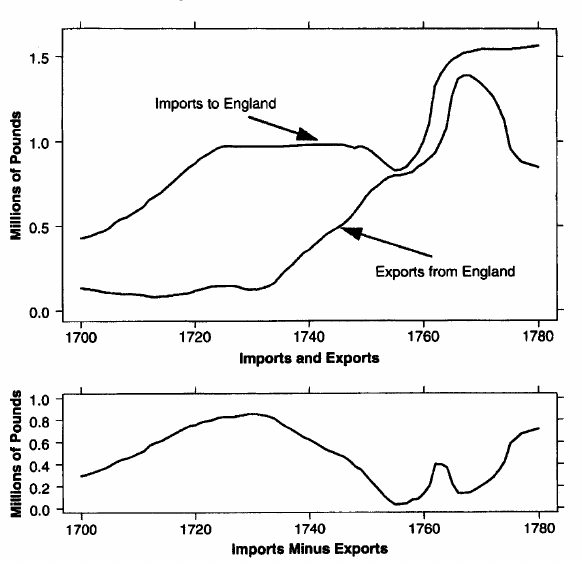
Show Differences Directly
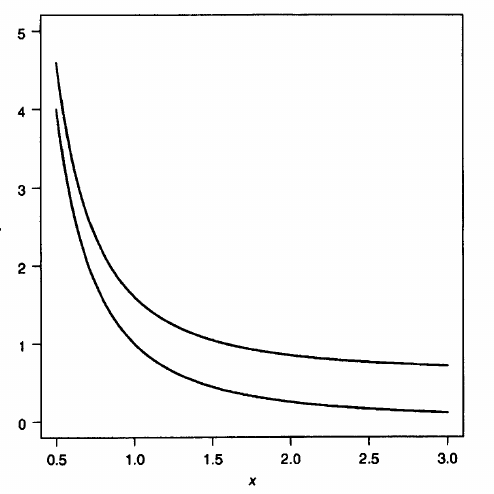
- Position is much easier to judge than length
- These curves have a constant height difference
![Robbins 2004]()
Show Differences Directly
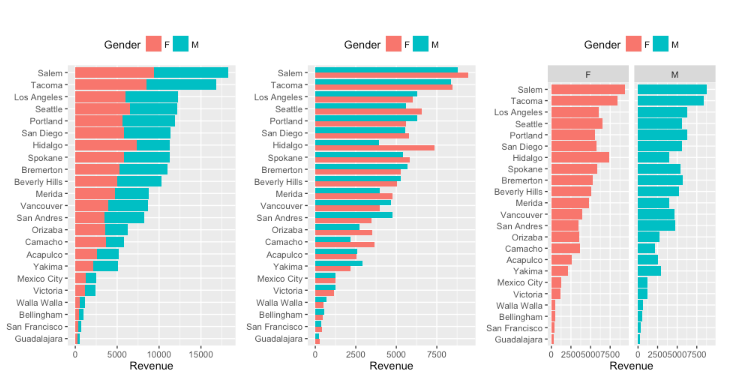
- Adjacent Bars Versus Dots on the same Axis
UCR Bus. Analytics
Show Differences Directly
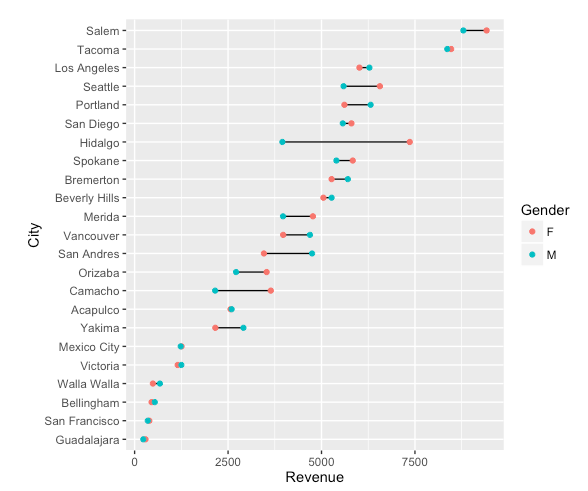
- Adjacent Bars Versus Dots on the same Axis
UCR Bus. Analytics
Perceptually Uniform Colormaps
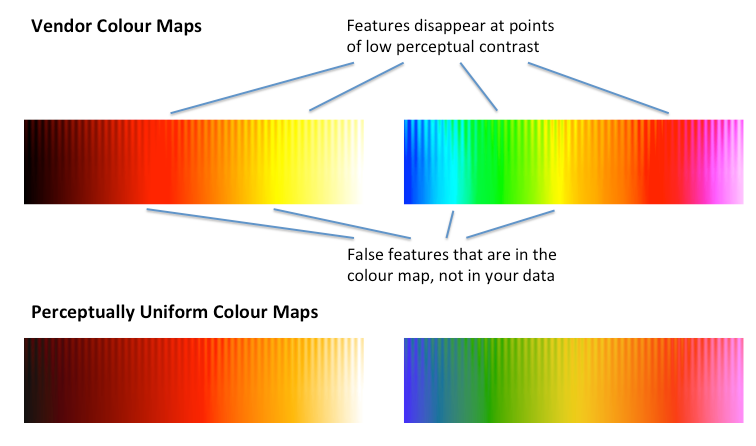
- Colormaps attach color to number
- Visual complexity makes it easy for the colormap to create features that aren’t there or to hide features
![colorcet]()
Colormap Example
- Which colormap renders the surface height better?
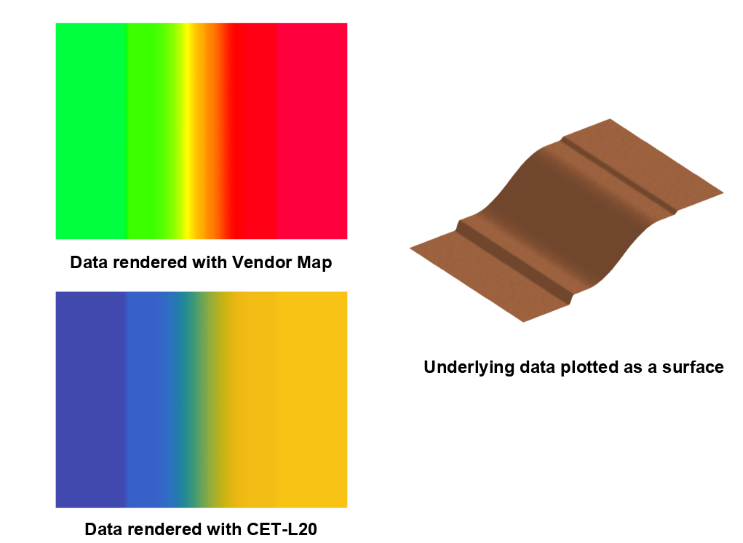
colorcet
Colormap Types: Sequential/Perceptually Uniform
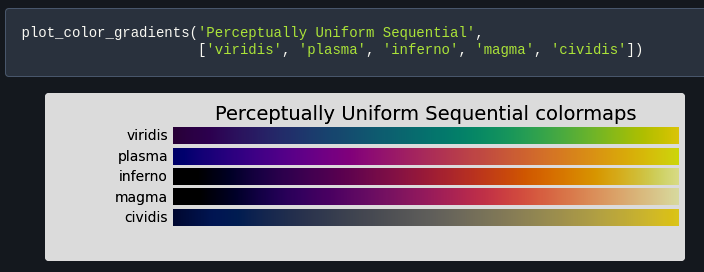
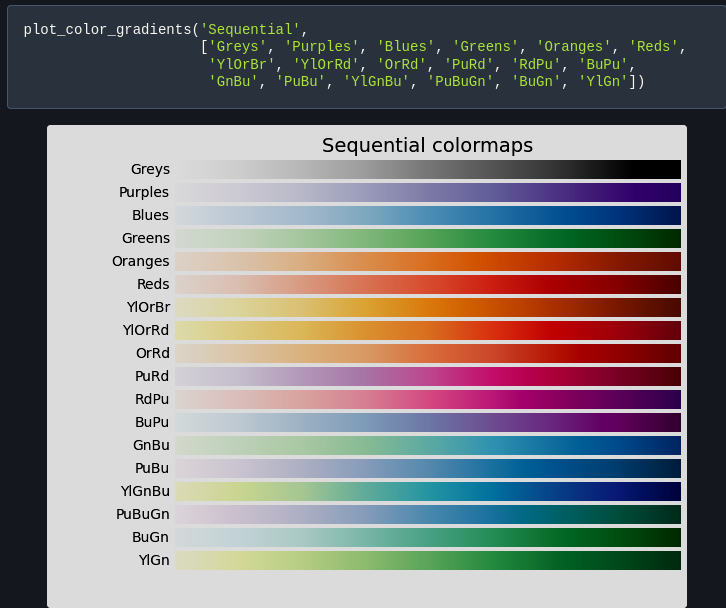
Colormap Types: Sequential
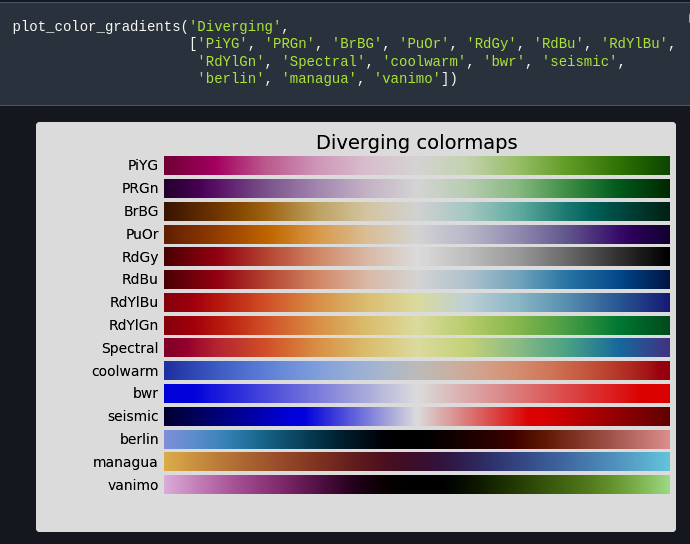
Colormap Types: Diverging
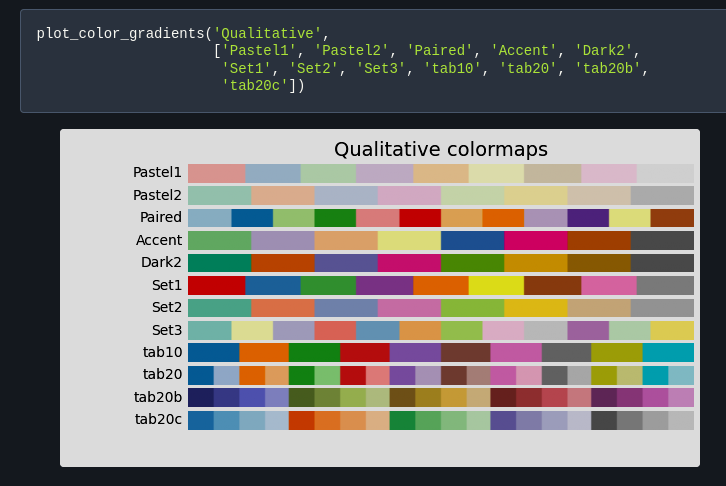
Colormap Types: Qualitative
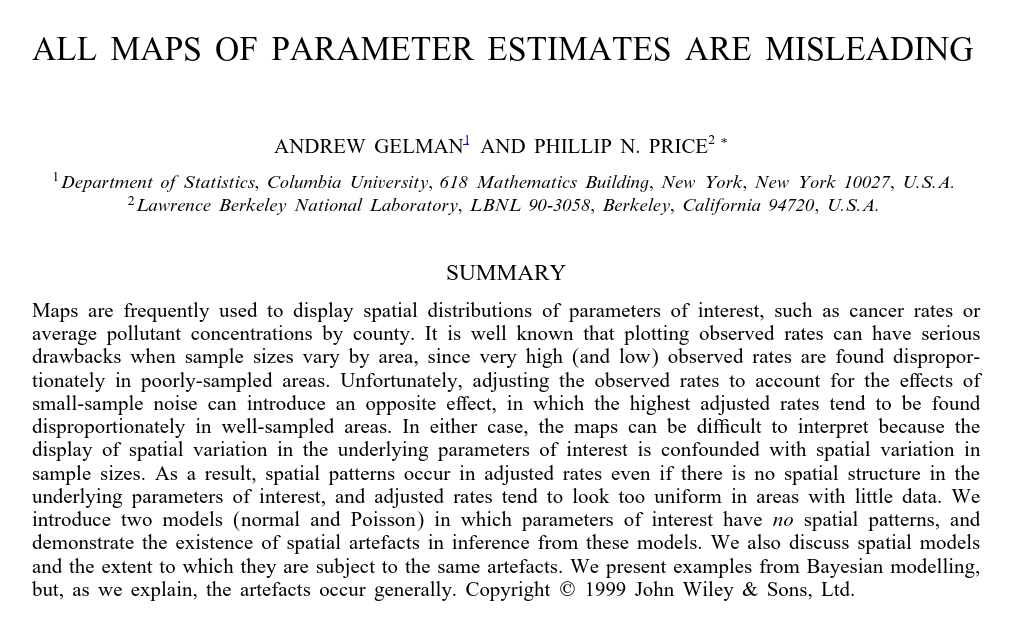
Do you need a map?
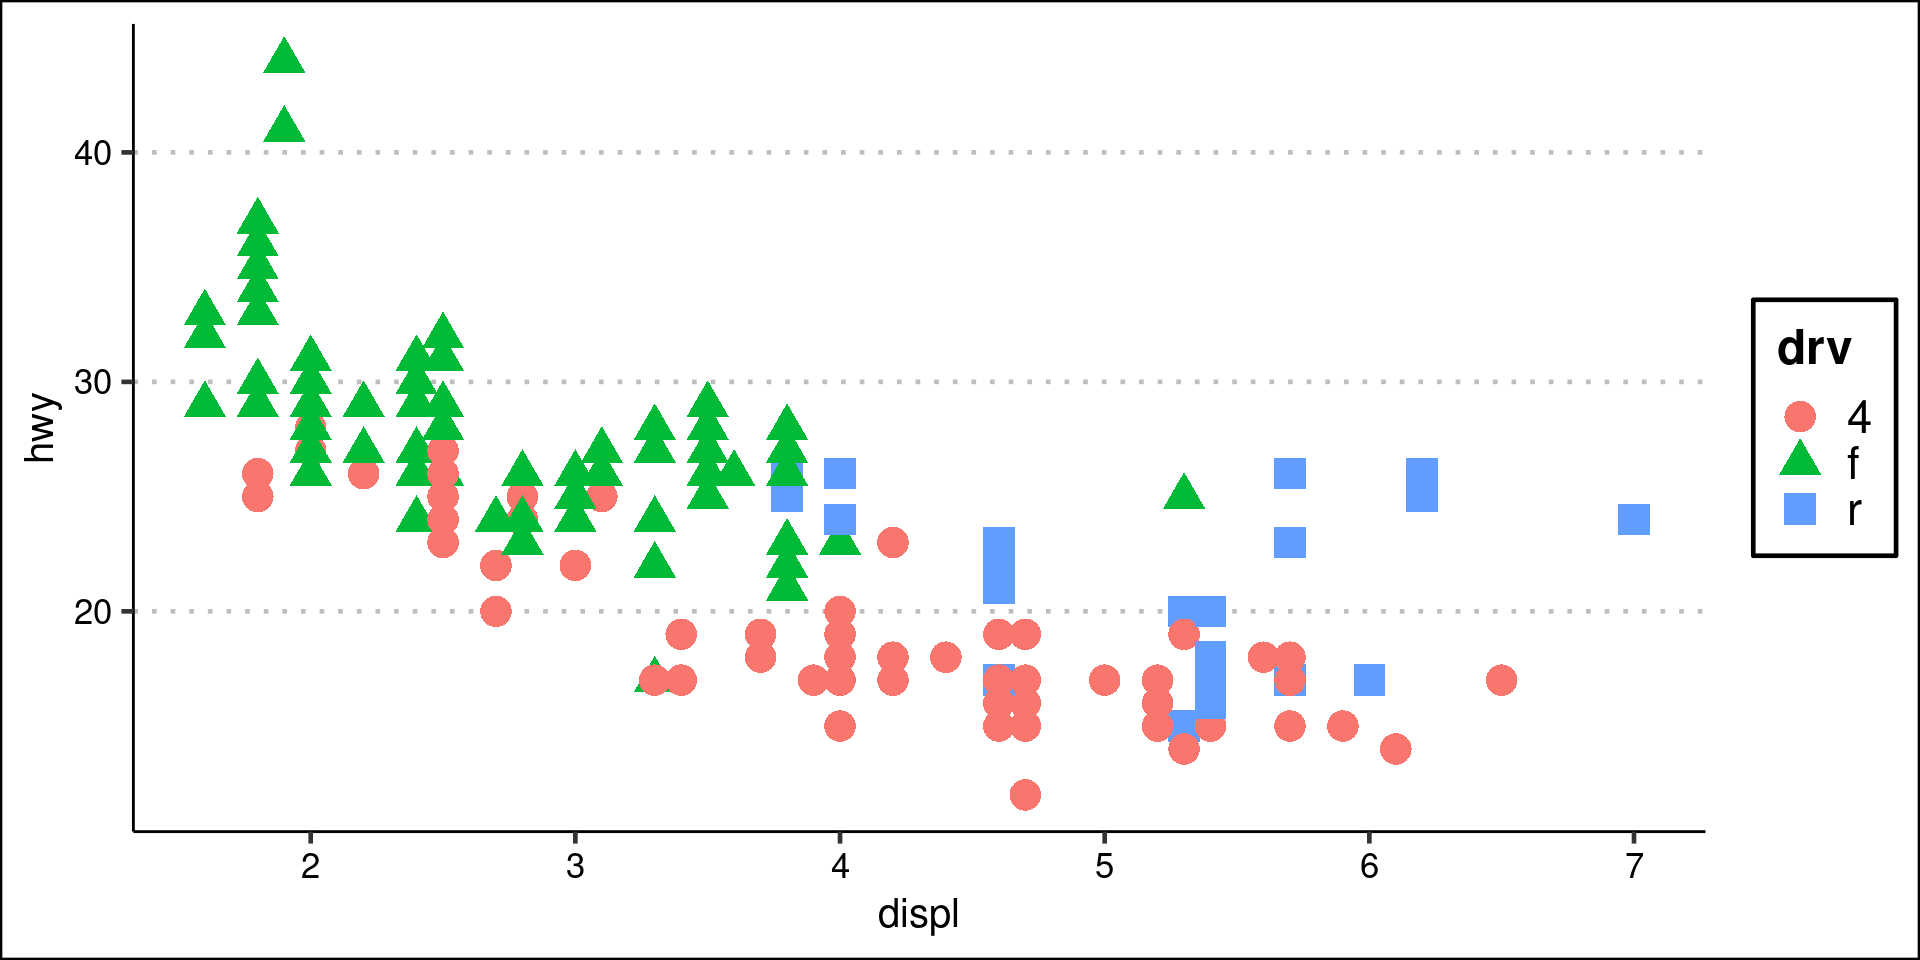
Categories/Qualitative Features
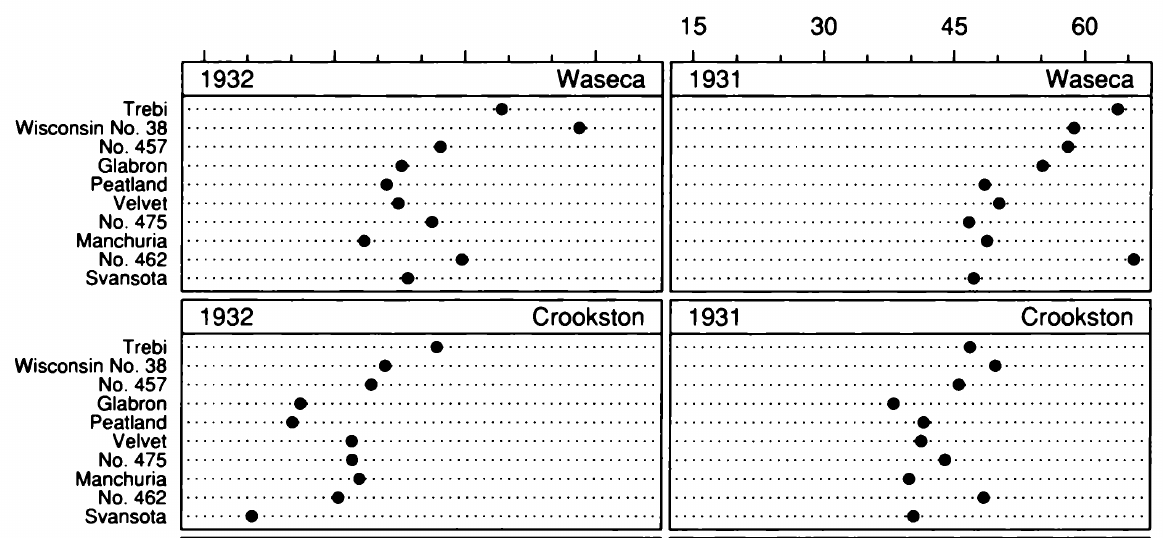
- Hue/Color and Shape are good for differentiating categories
- Category limit 5 or 6
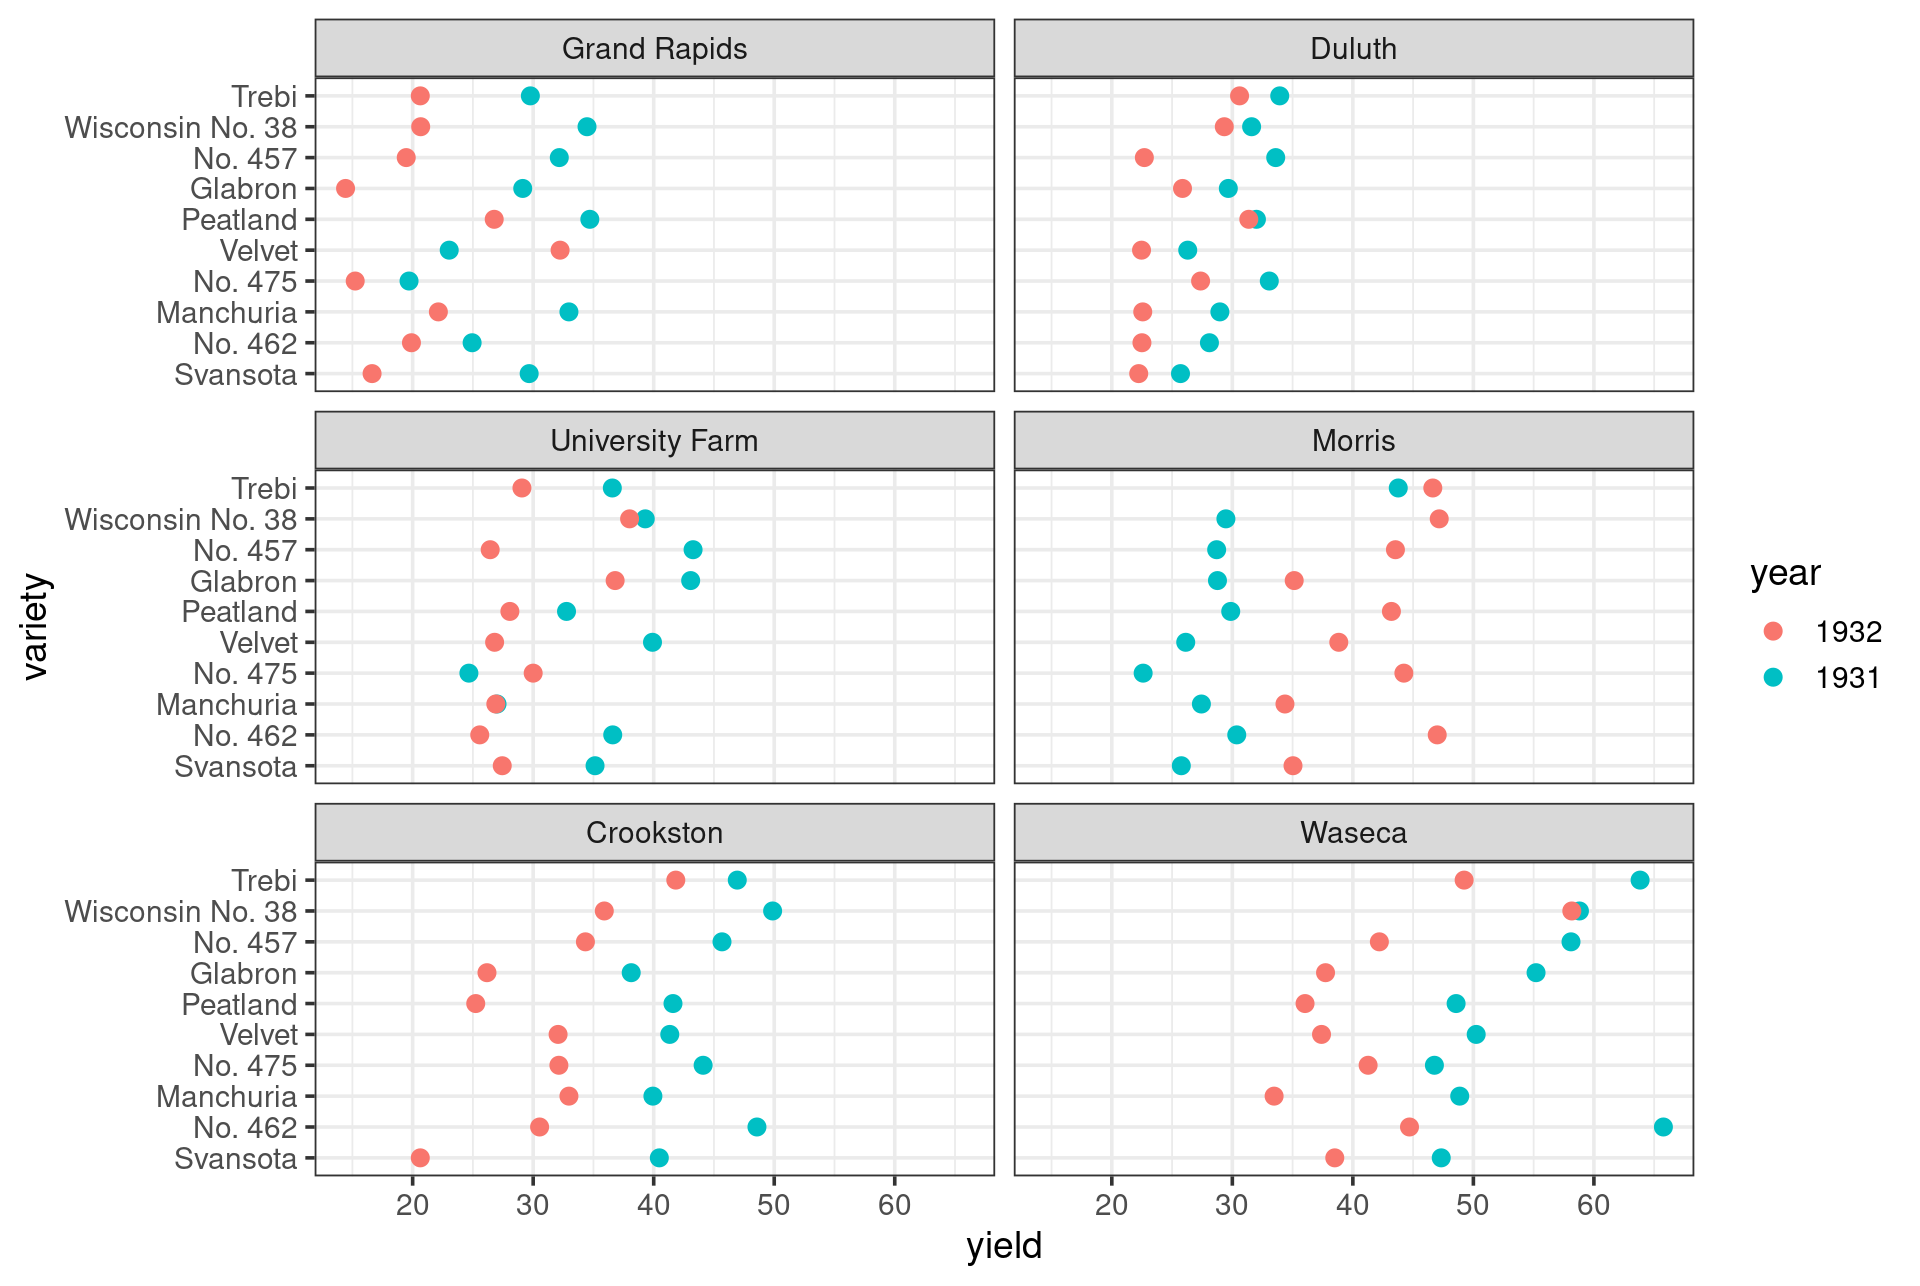
Small Multiples Example
Thanks!