Meetup 6: Narrative Structure

George I. Hagstrom

Week Summary

  • Goal of this week: think more concretely about stories
  • Read: Chapter 29 of Fundamentals, Chapter 7 of Storytelling
  • HW: Data Story 3 Due on Sunday

November Meetup!

Story 2:

  • All figures should have big idea!

Story 2:

  • All figures should have big idea!

Story 2:

  • All figures should have big idea!

Story 2:

  • Do not turn in a long written report.
  • Good to great: Making the figures work together more coherently

What is a story?

  • From Fundamentals:

A story is a set of observations, facts, or events, true or invented, that are presented in a specific order such that they create an emotional reaction in the audience.

Why emotion?

  • Quantitative culture: dismissive of stories, emotion
    • Deemed “squishy”
  • This is a bad mistake
    • Emotional response is key to how we communicate
  • You can tell stories while objectively presenting the truth

How do stories create an emotional response?

  • Initial build up of conflict and tension
  • Release of tension at the conclusion of story

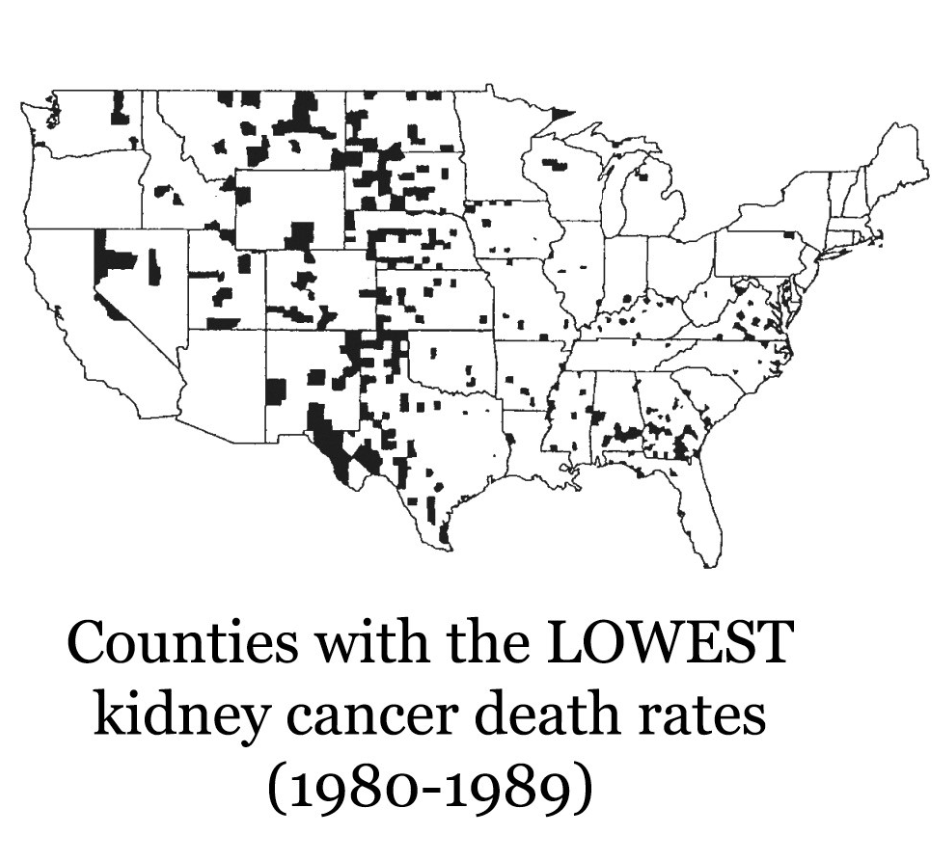
Example: Where are the Cancers?

Gelman Hill Teaching Stats

  • Lowest counties all rural

Why Lowest Cancer in Rural Areas?

  • Maybe rural counties have lower pollution?

Why Lowest Cancer in Rural Areas?

  • Maybe rural counties have lower pollution?
  • Healthier, fresher food?

Why Lowest Cancer in Rural Areas?

  • Maybe rural counties have lower pollution?
  • Healthier, fresher food?
  • Low stress, active lifestyle?

Why Lowest Cancer in Rural Areas?

  • Maybe rural counties have lower pollution?
  • Healthier, fresher food?
  • Low stress, active lifestyle?

Shall we fund a big study to investigate???

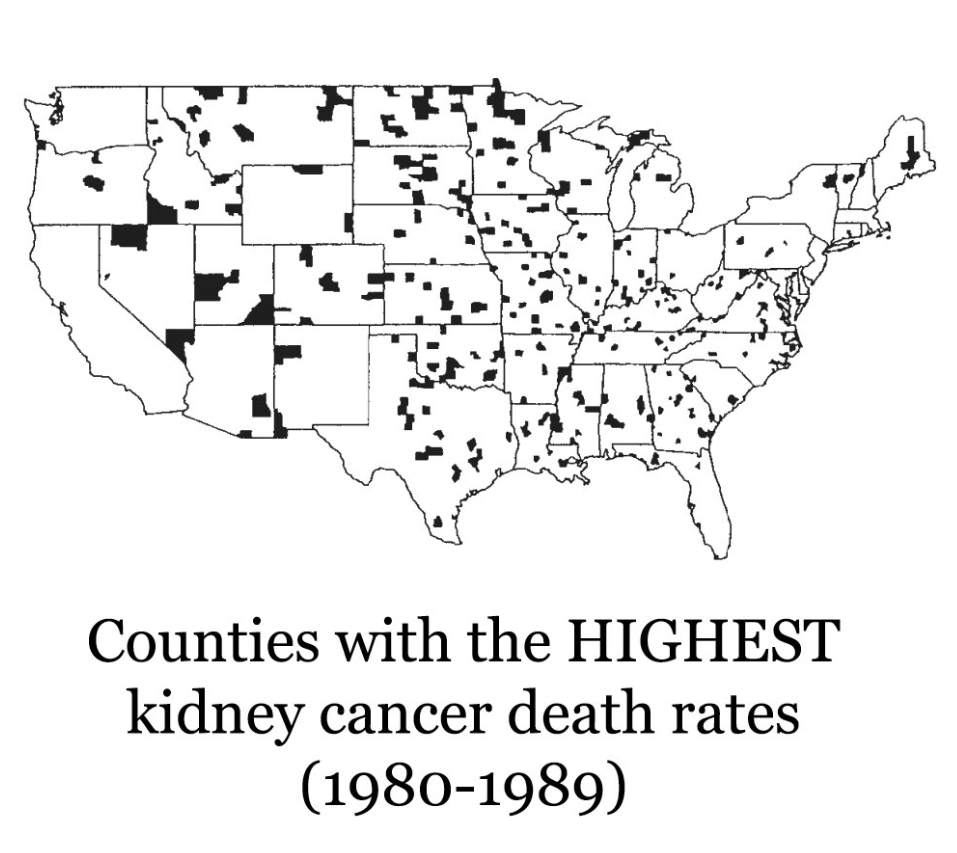
Plot Twist

Gelman Hill Bag of Tricks

  • Rural counties also have the highest death rates!

Thought Experiment: Consider a small county

  • The county has 100 people
  • If it has 1 kidney cancer death in the decade, it’s rate will be by far the highest in the country
  • If it has 0 deaths, it’s rate will be the lowest in the country

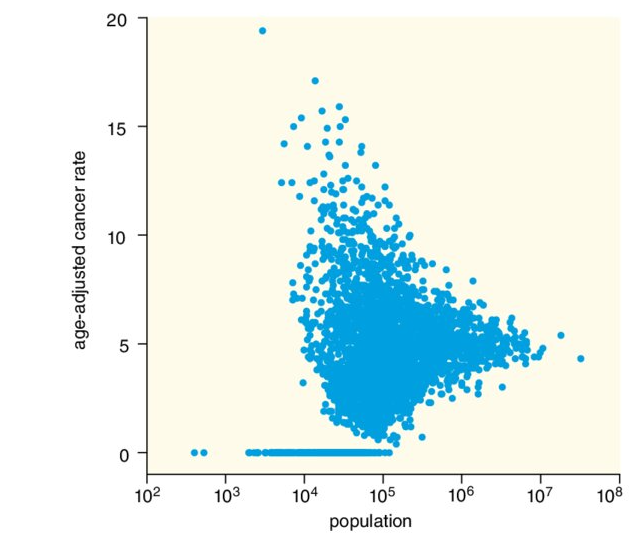
Variance of a binomial distribution

  • probability \(p\) of dying from kidney cancer
  • rate \(\hat{r}=\frac{m}{n}\) observed deaths divided by population \[ \mathrm{var}(\hat{r}) = \frac{p(1-p)}{n} \]
  • Big \(n\) close to mean
  • Expect small counties to dominate the extremes

Be skeptical of maps

  • This phenomenon isn’t unique to this variable
  • See this funnel shape all the time!

Aside

  • Funnel plot also good for showing bias in research studies
  • Effect size gets small when study is bigger

Story Arc

  • Opening: Why are Cancer rates lowest in rural counties?
  • Challenge: They are also highest in rural counties!
  • Action: Use stats, binomial variance formula
  • Resolution: Be wary when comparing unequally sized groups

Story Arcs

  • A story arc is a pattern which a story takes
  • It is designed to build and then resolve conflict
  • There are several different structures for arcs

Arc 1

  • Opening
  • Challenge
  • Action
  • Resolution

Arc 2

  • Lead: Give away main point
  • Development: Introduction and details
  • Resolution: Return to main point and moral

Arc 2 applied

  • Lead: Maps are biased because of population heterogeneities
  • Development: You can draw contradictory conclusions from maps. They can show that rural living both prevents and causes Kidney Cancer. This is because rural counties have high variance
  • Resolution: This issue plays a role whenever you compare groups of different sizes. Always consider standard errors!

Arc 2 applied (alt)

  • Lead: All maps lie to you
  • Development: You can draw contradictory conclusions from maps. They can show that rural living both prevents and causes Kidney Cancer. This is because rural counties have high variance
  • Resolution: This issue plays a role whenever you compare groups of different sizes. Always consider standard errors!

Arc 3

  • Action
  • Background
  • Development
  • Climax
  • Ending

Arc 3

  • Action: Show both figures together to get into conflict immediately
  • Background: Present other examples of this and the challenges they caused
  • Development: Connect with population size
  • Climax: Variance Formula, least squares techniques
  • Ending: Highlight importance across areas

Translating to Figures

  • Map your figures to story arc
  • (usually) need multiple figures

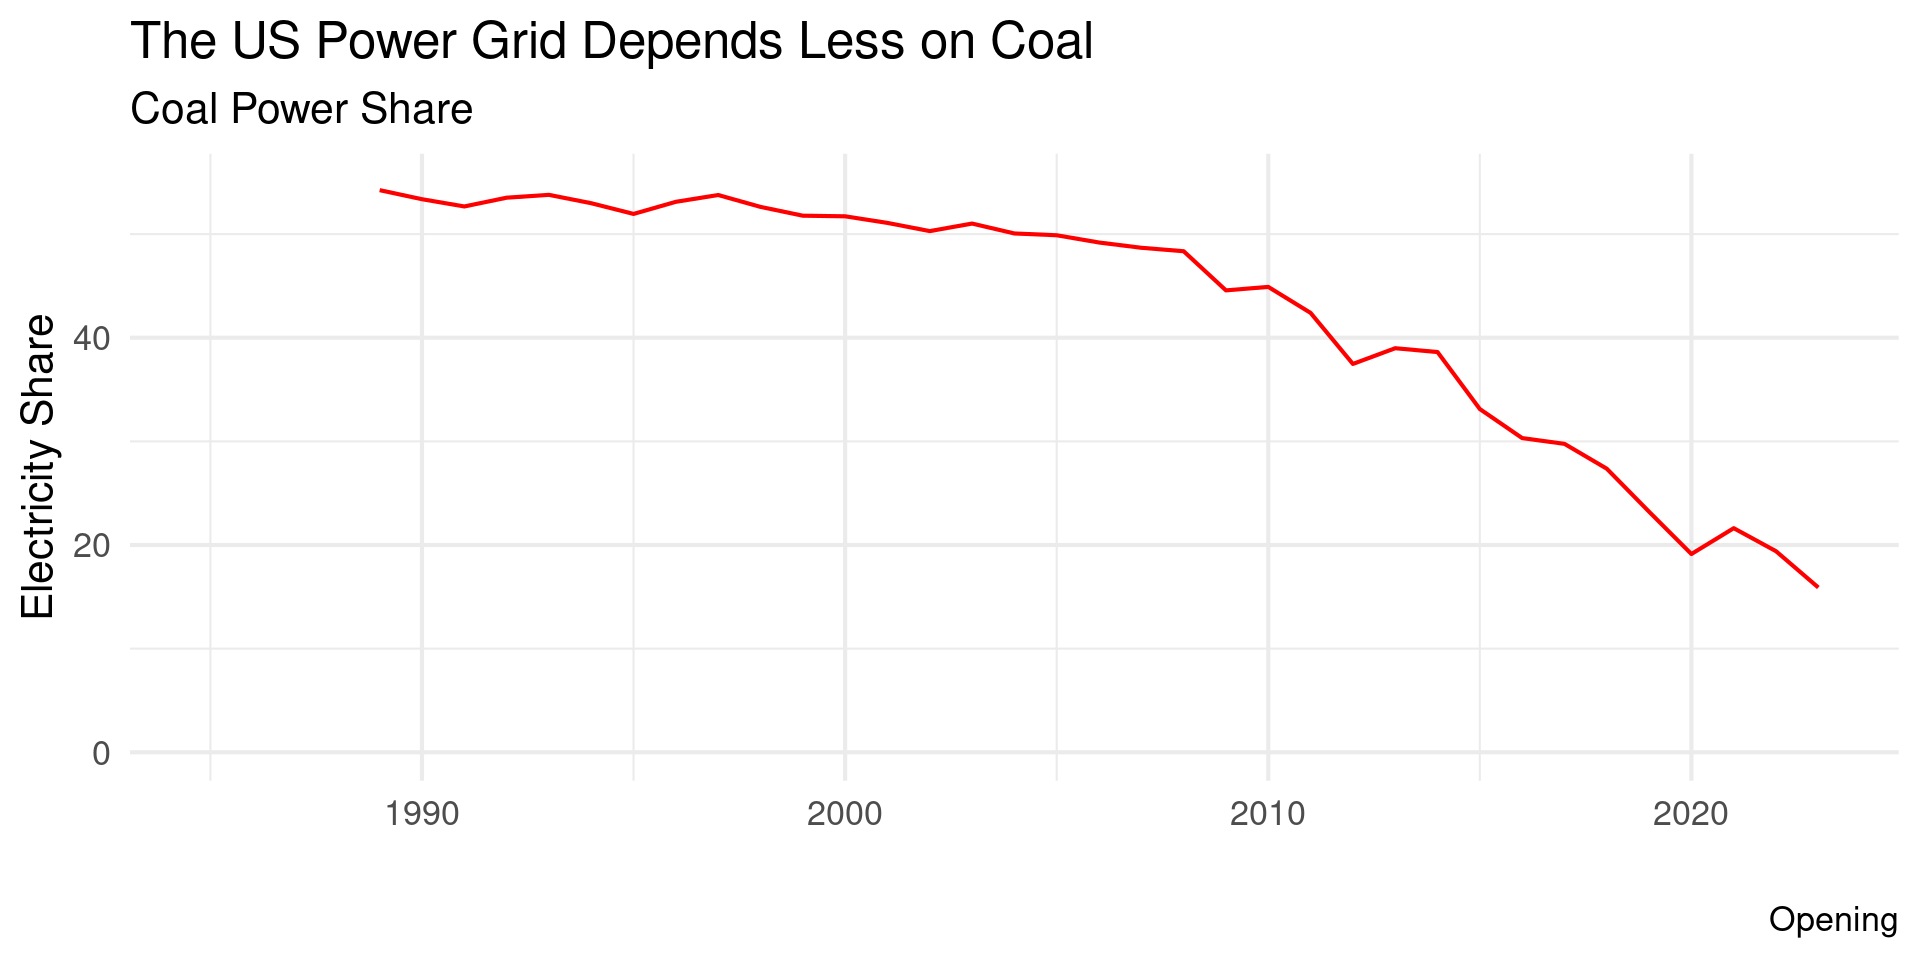
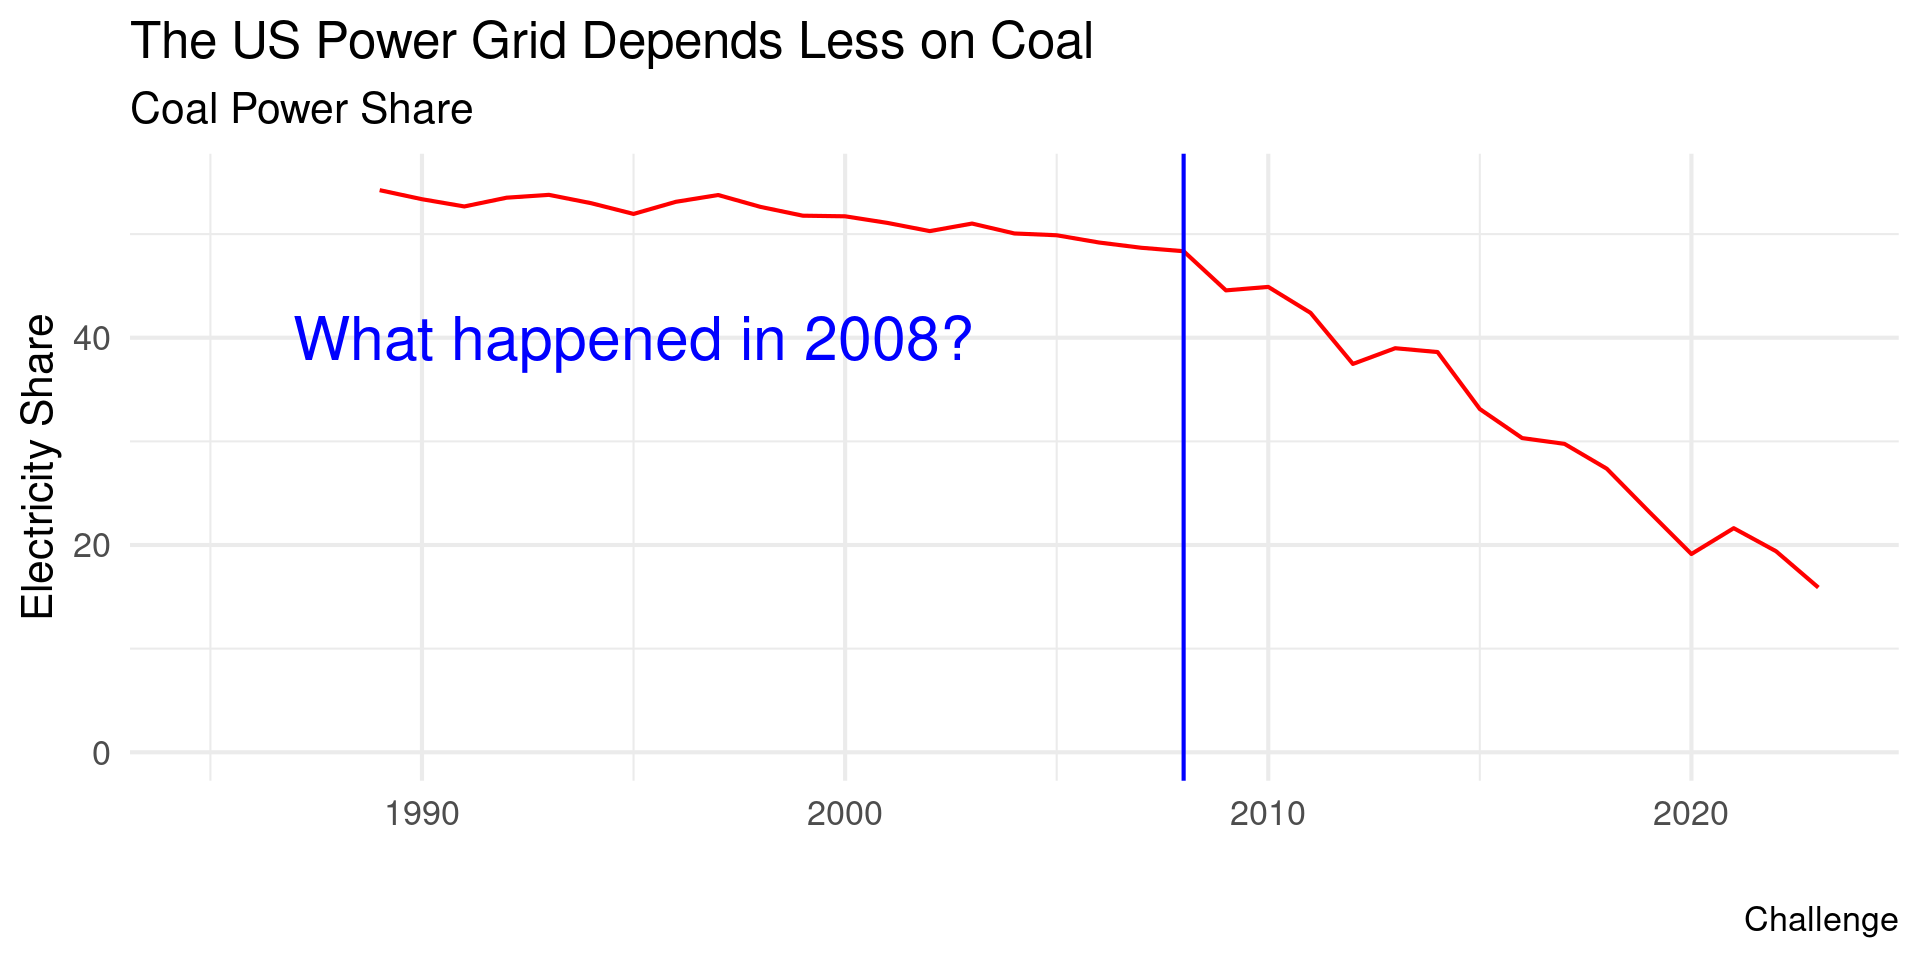
Example: Opening

Example: Challenge

Example: Action
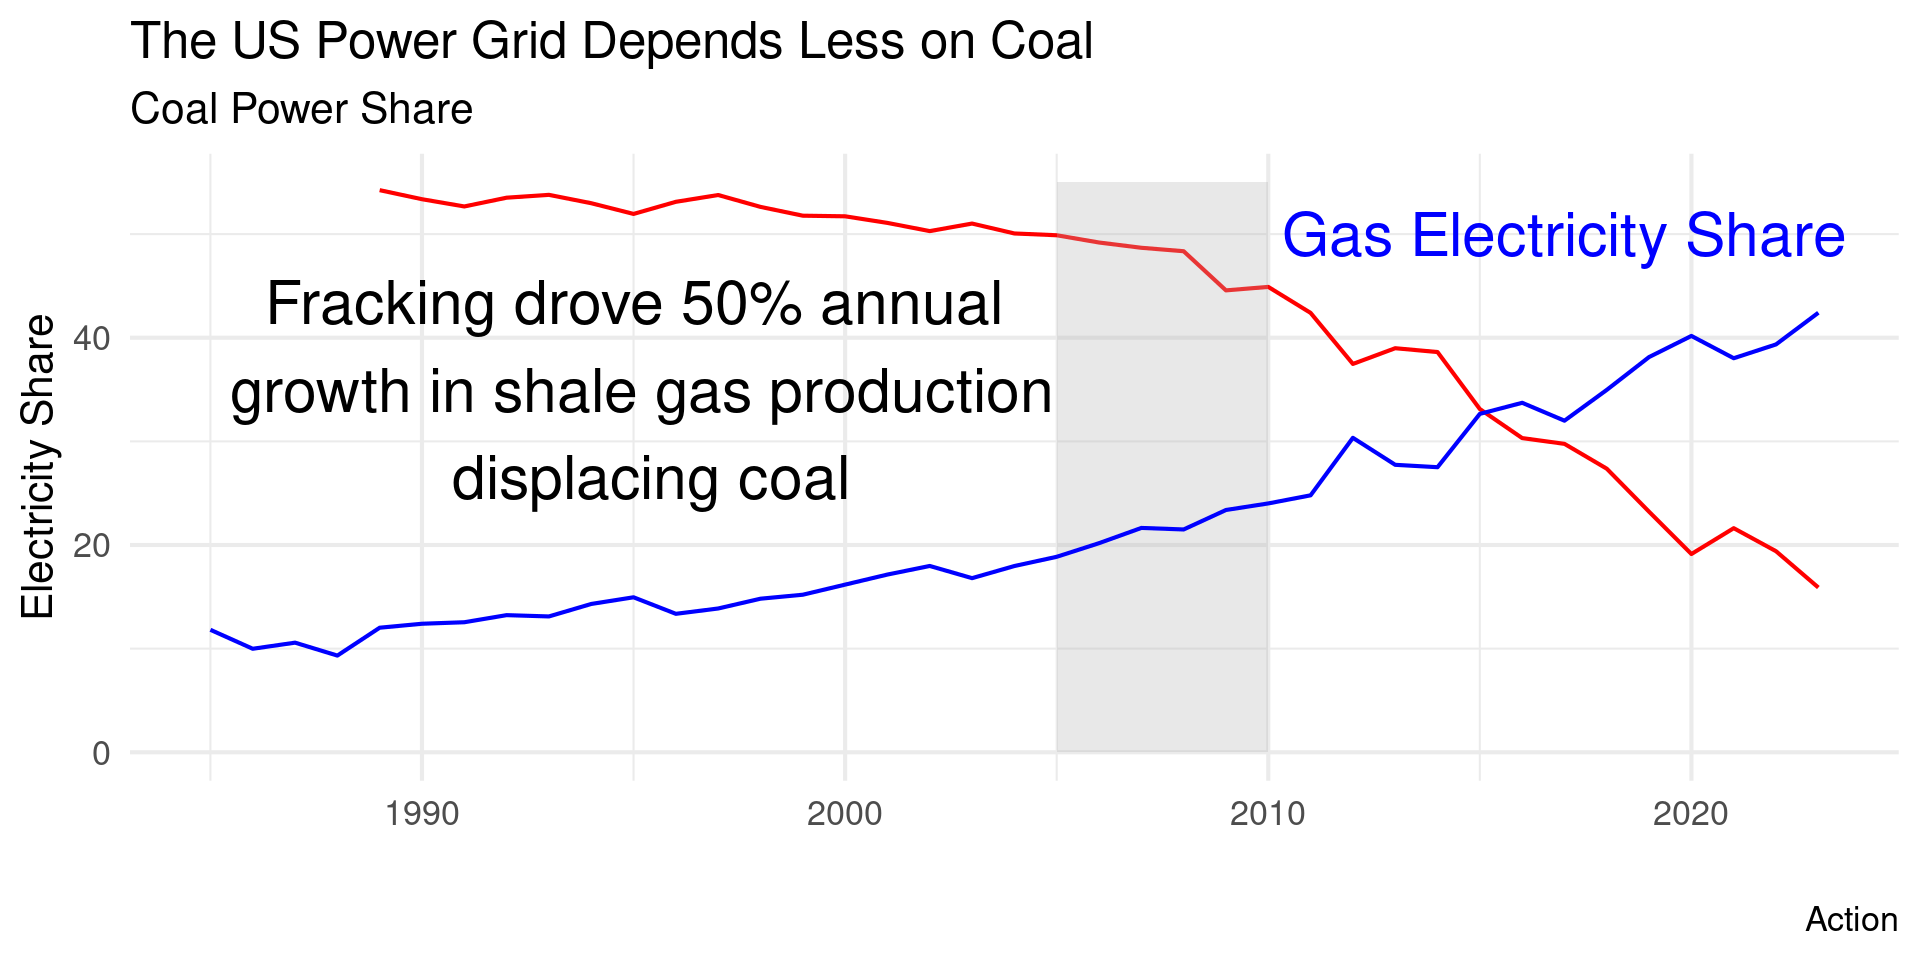
Example: Action
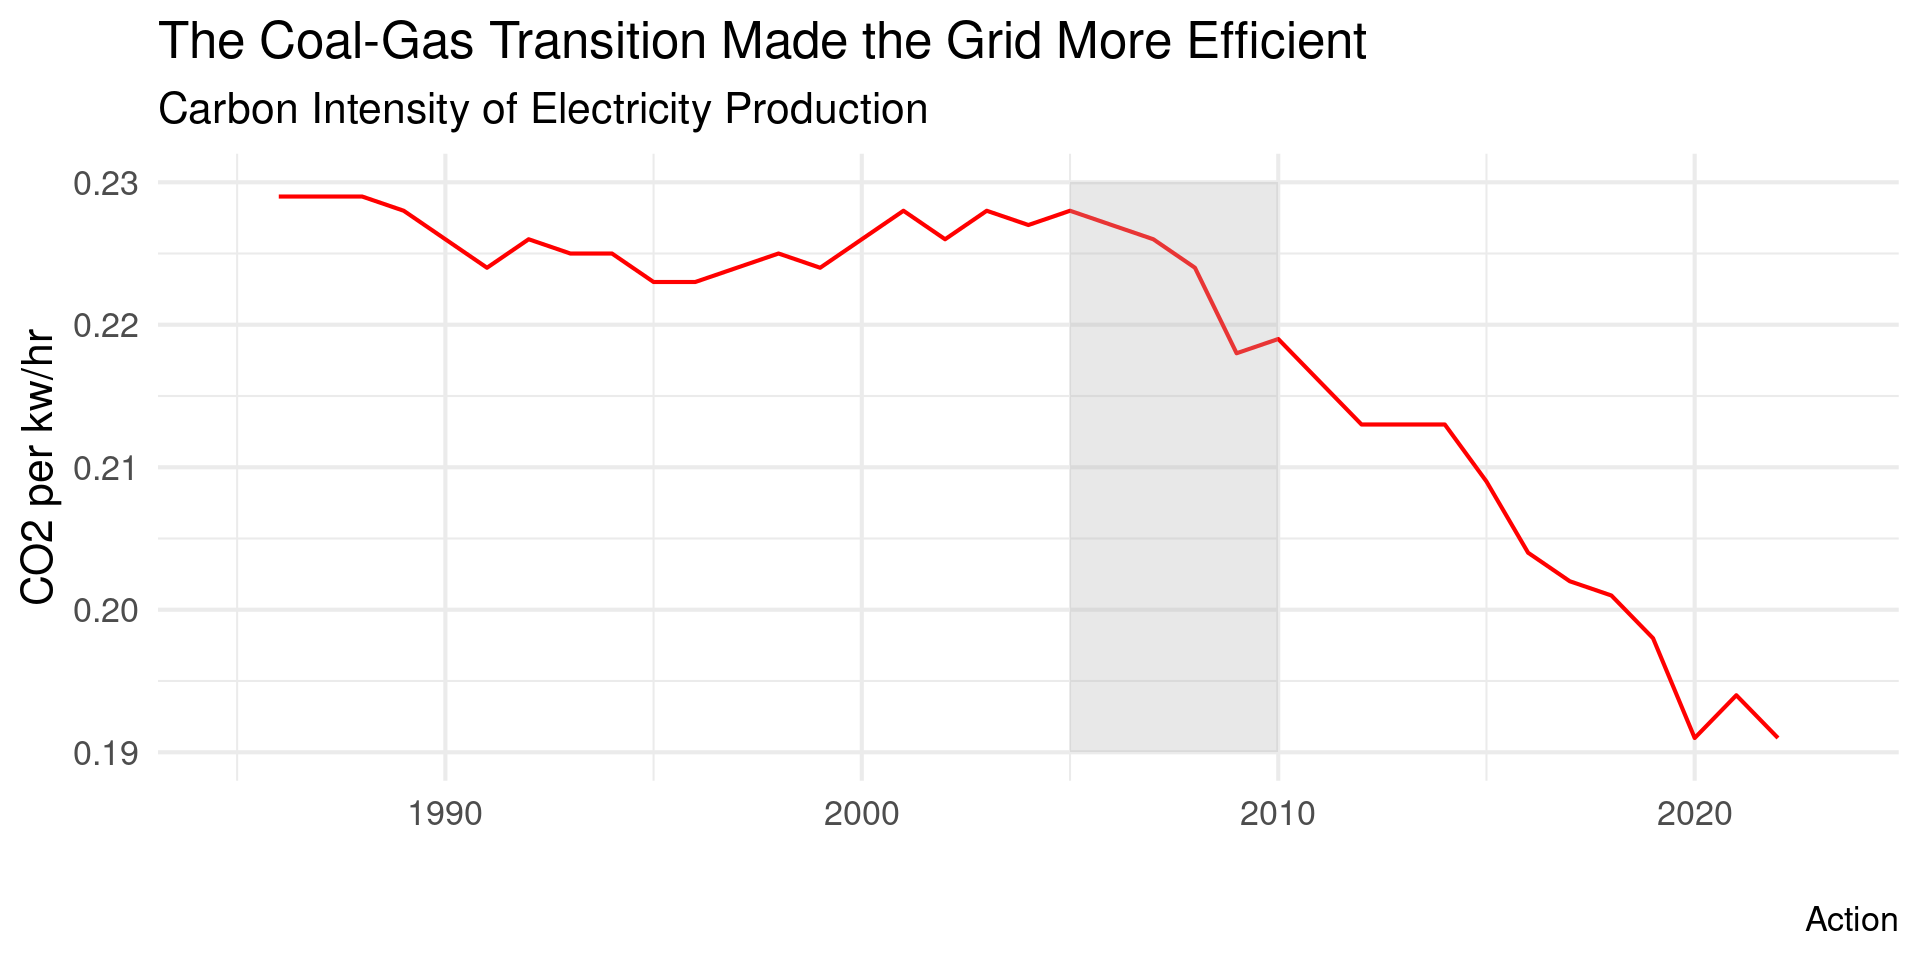
Example: Resolution
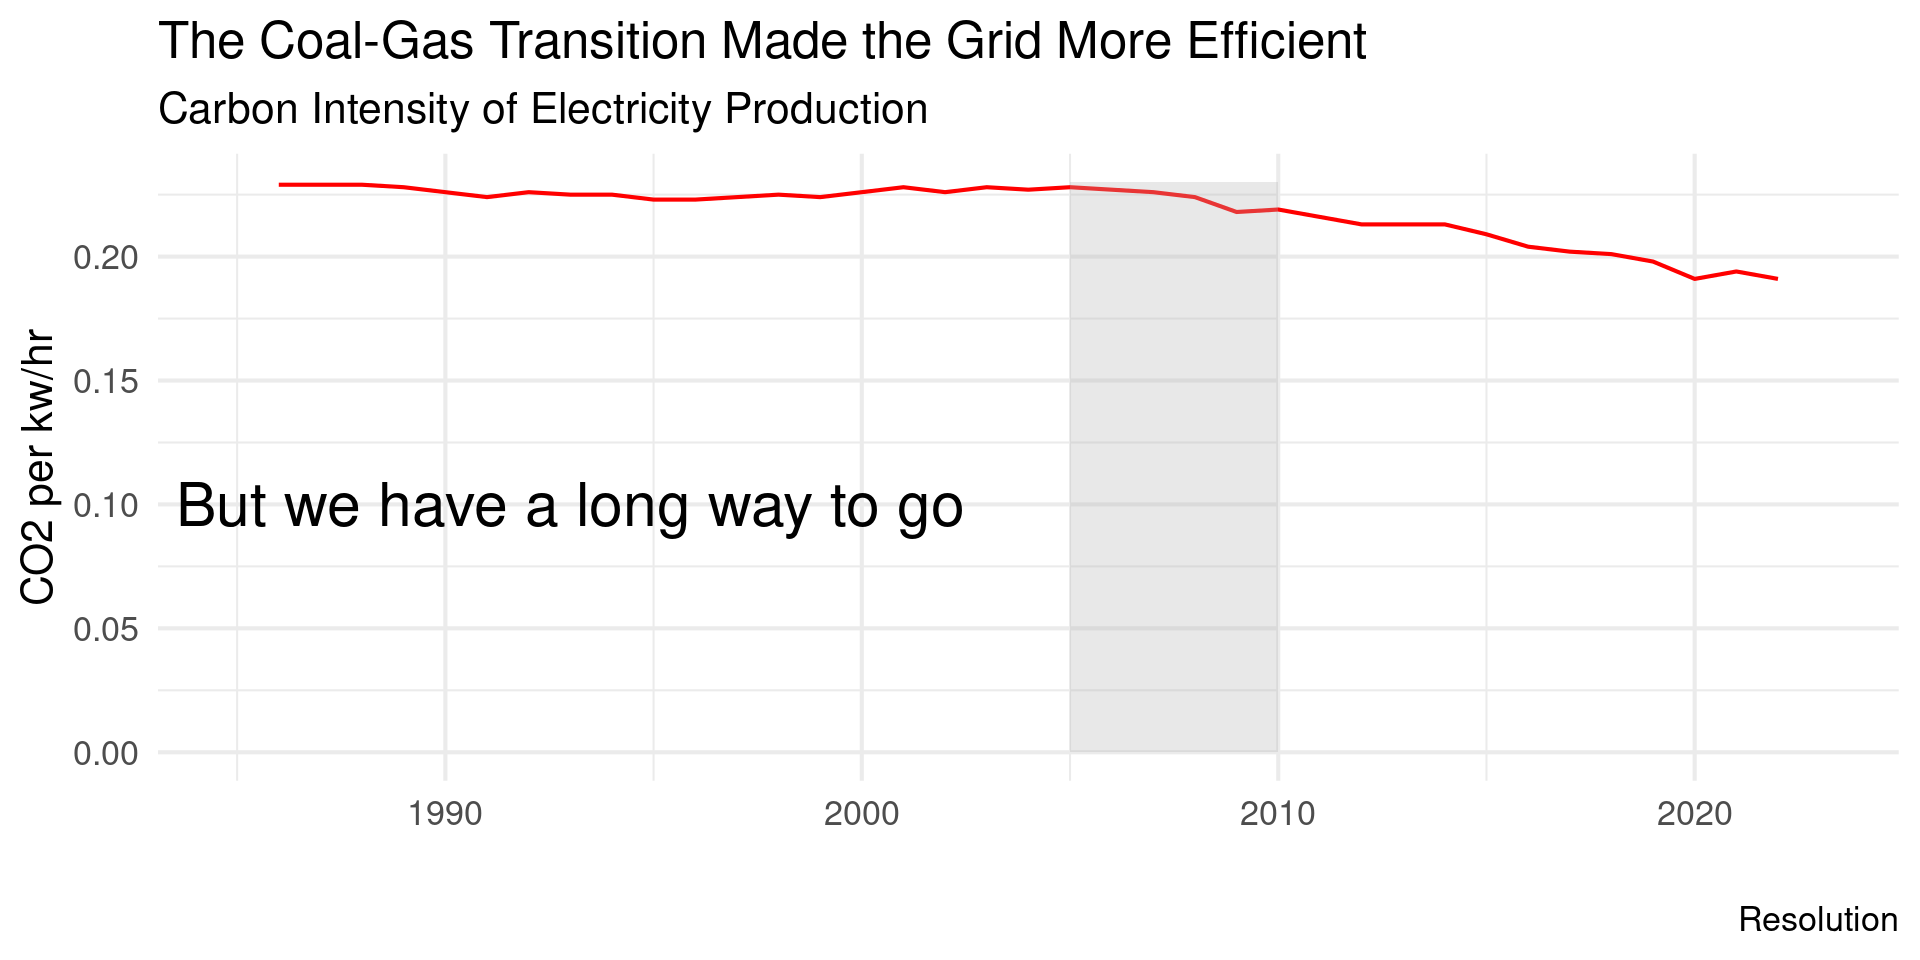
Example: Resolution
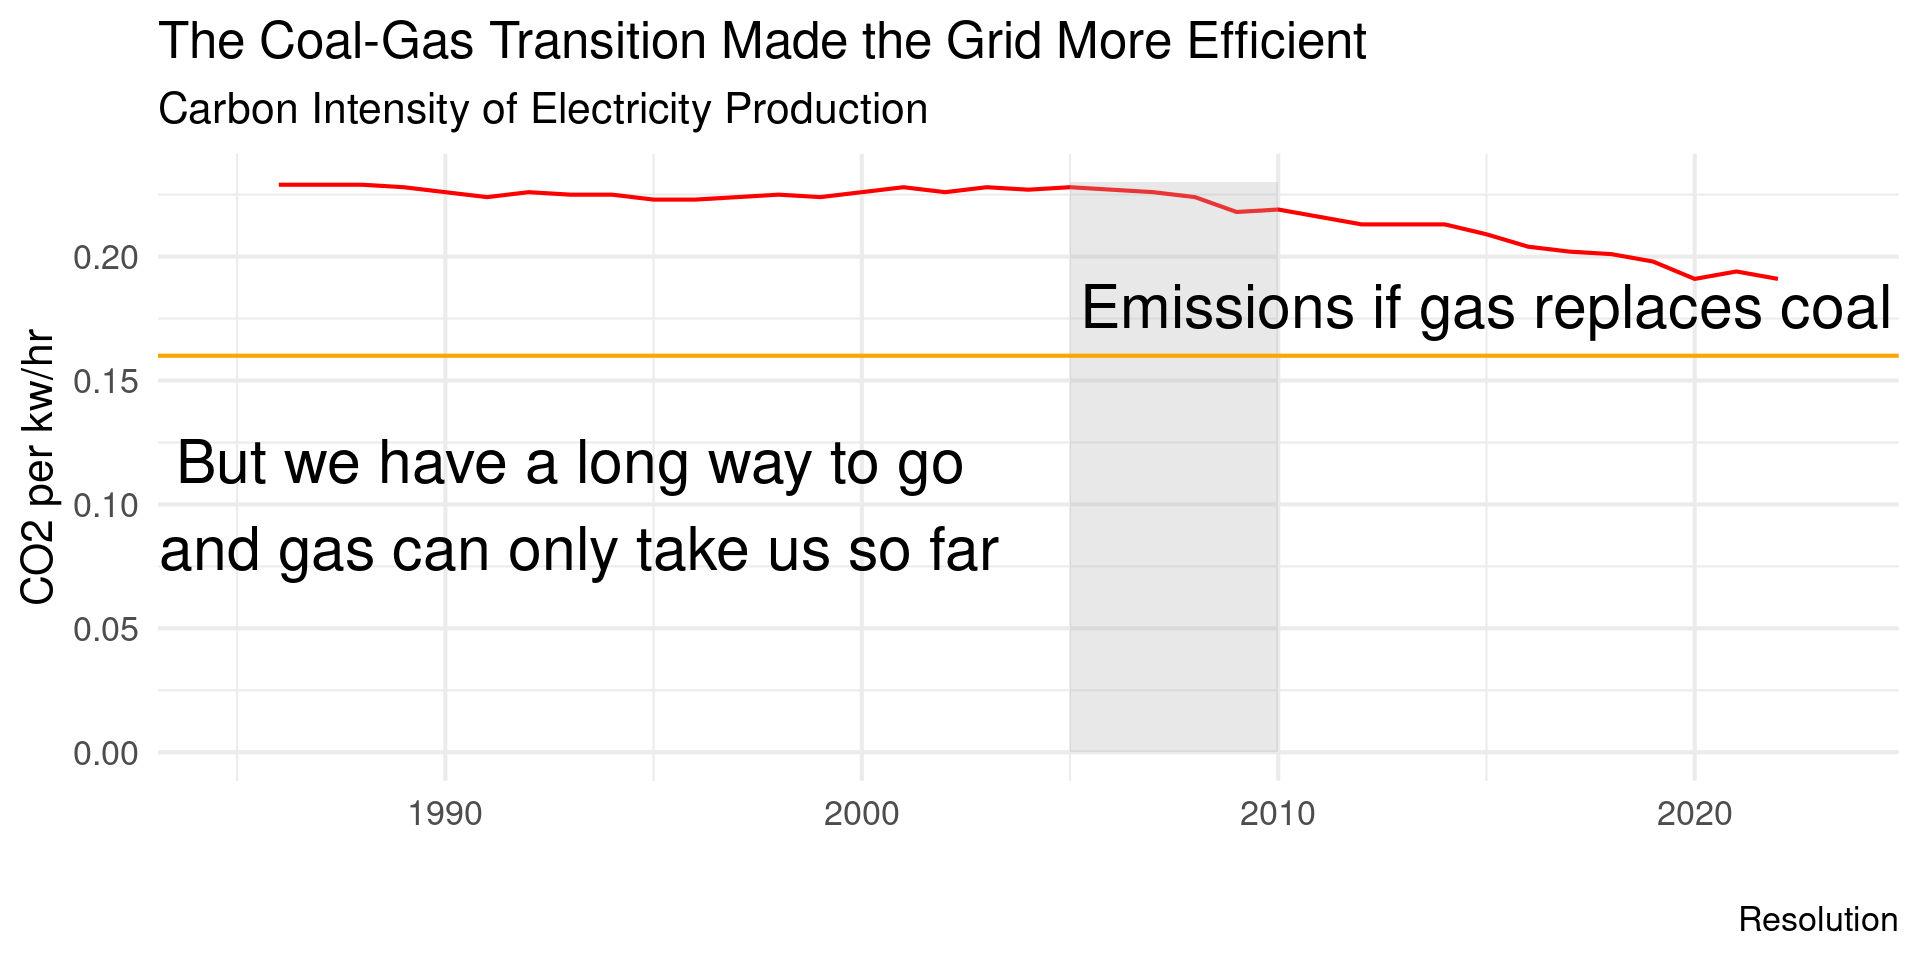
Example: Ending
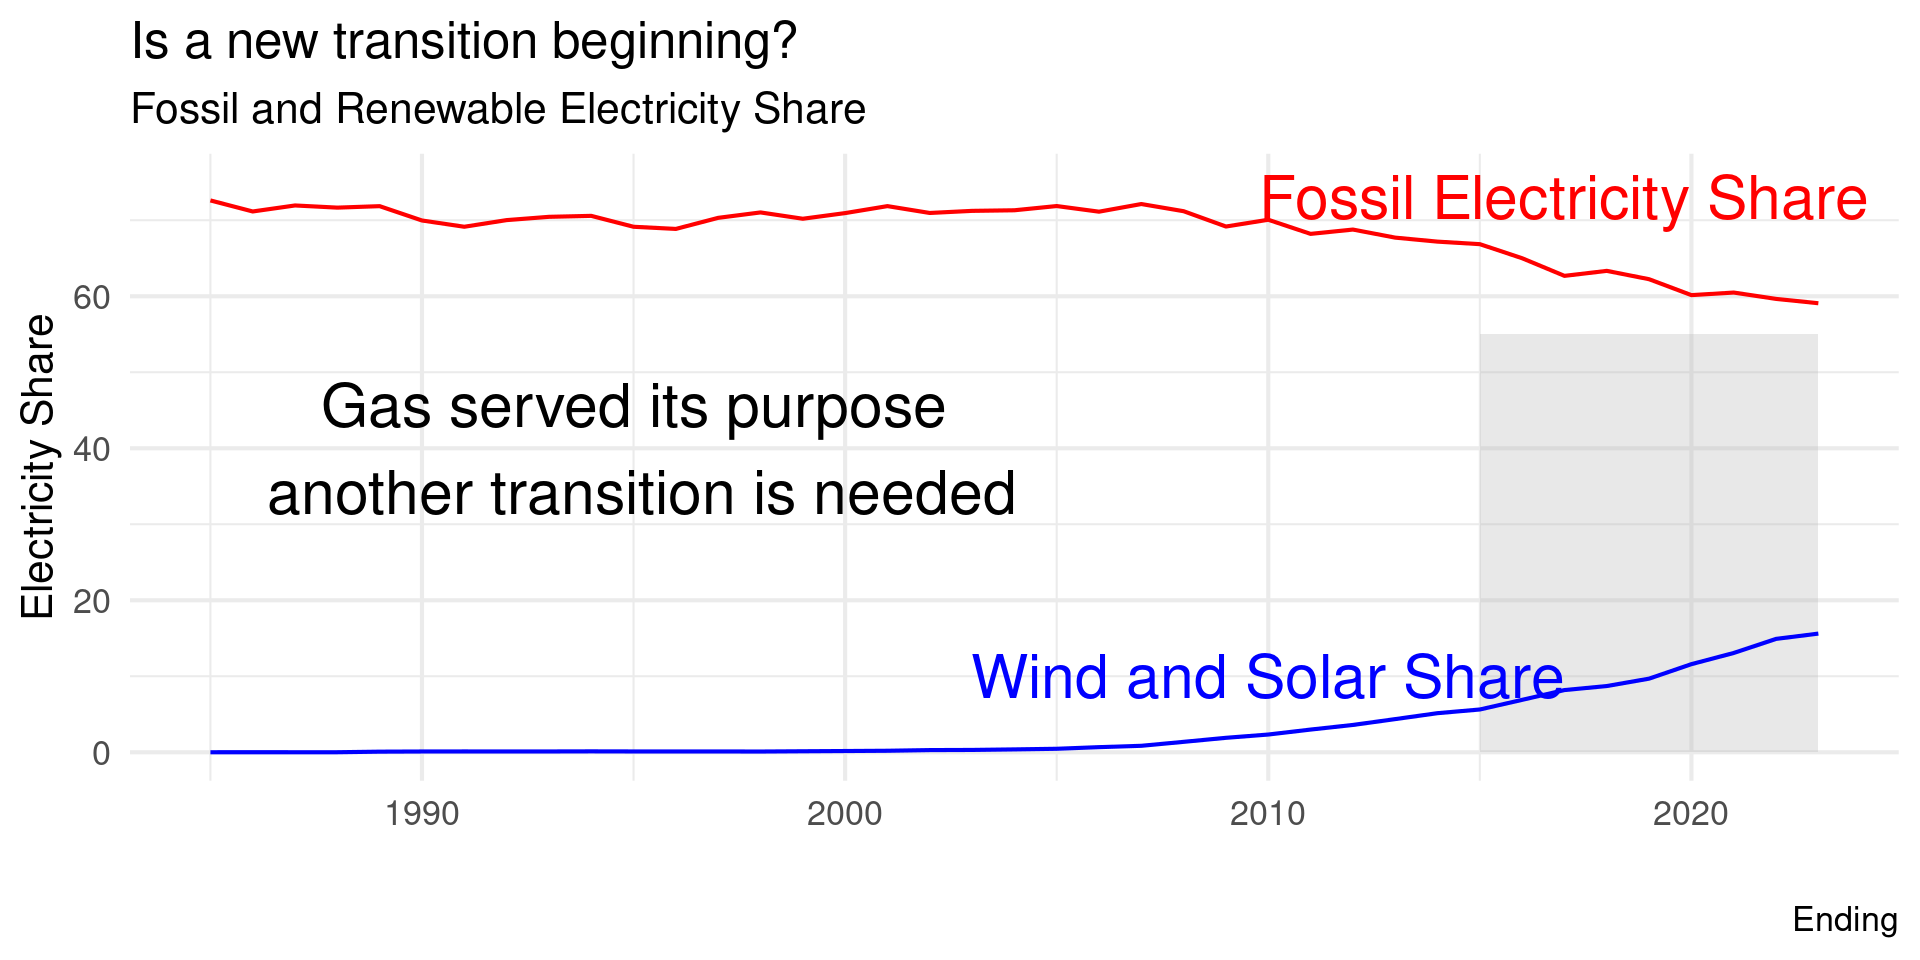
Making Figures for Busy People

  • Make your figure as simple as possible, but no simpler!
  • They shouldn’t need 30 minutes to decipher all the details
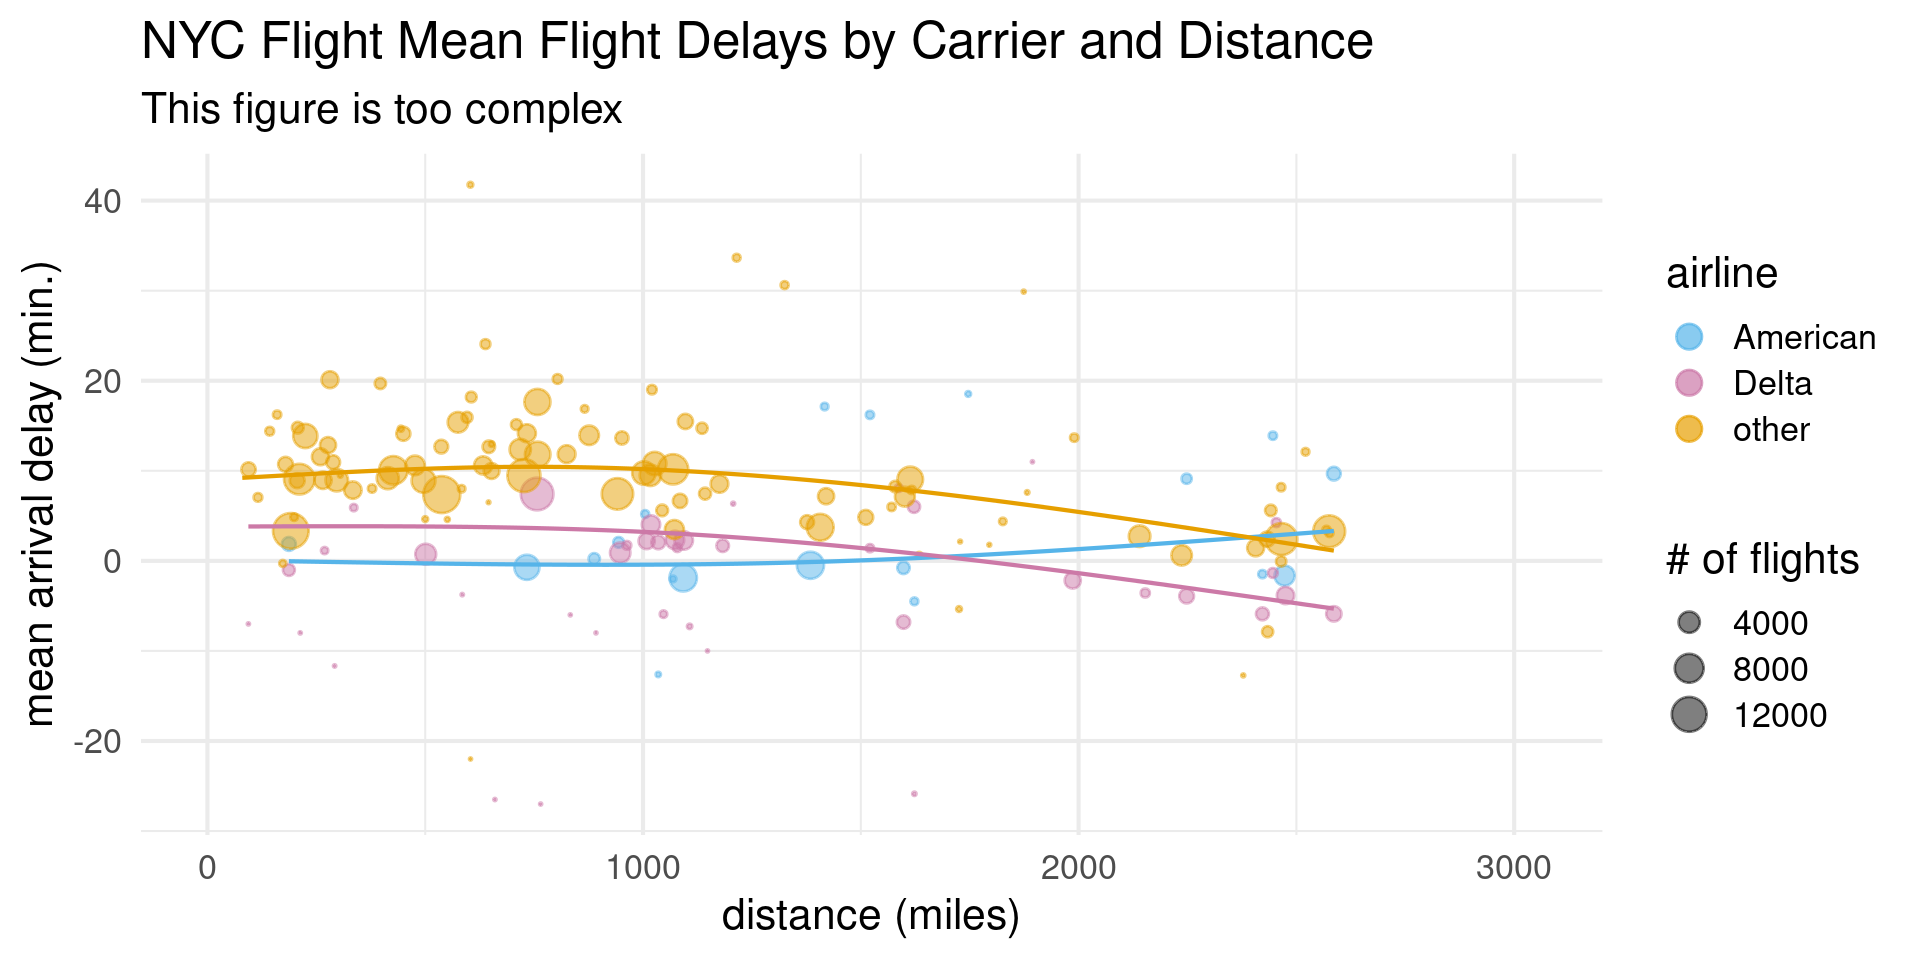
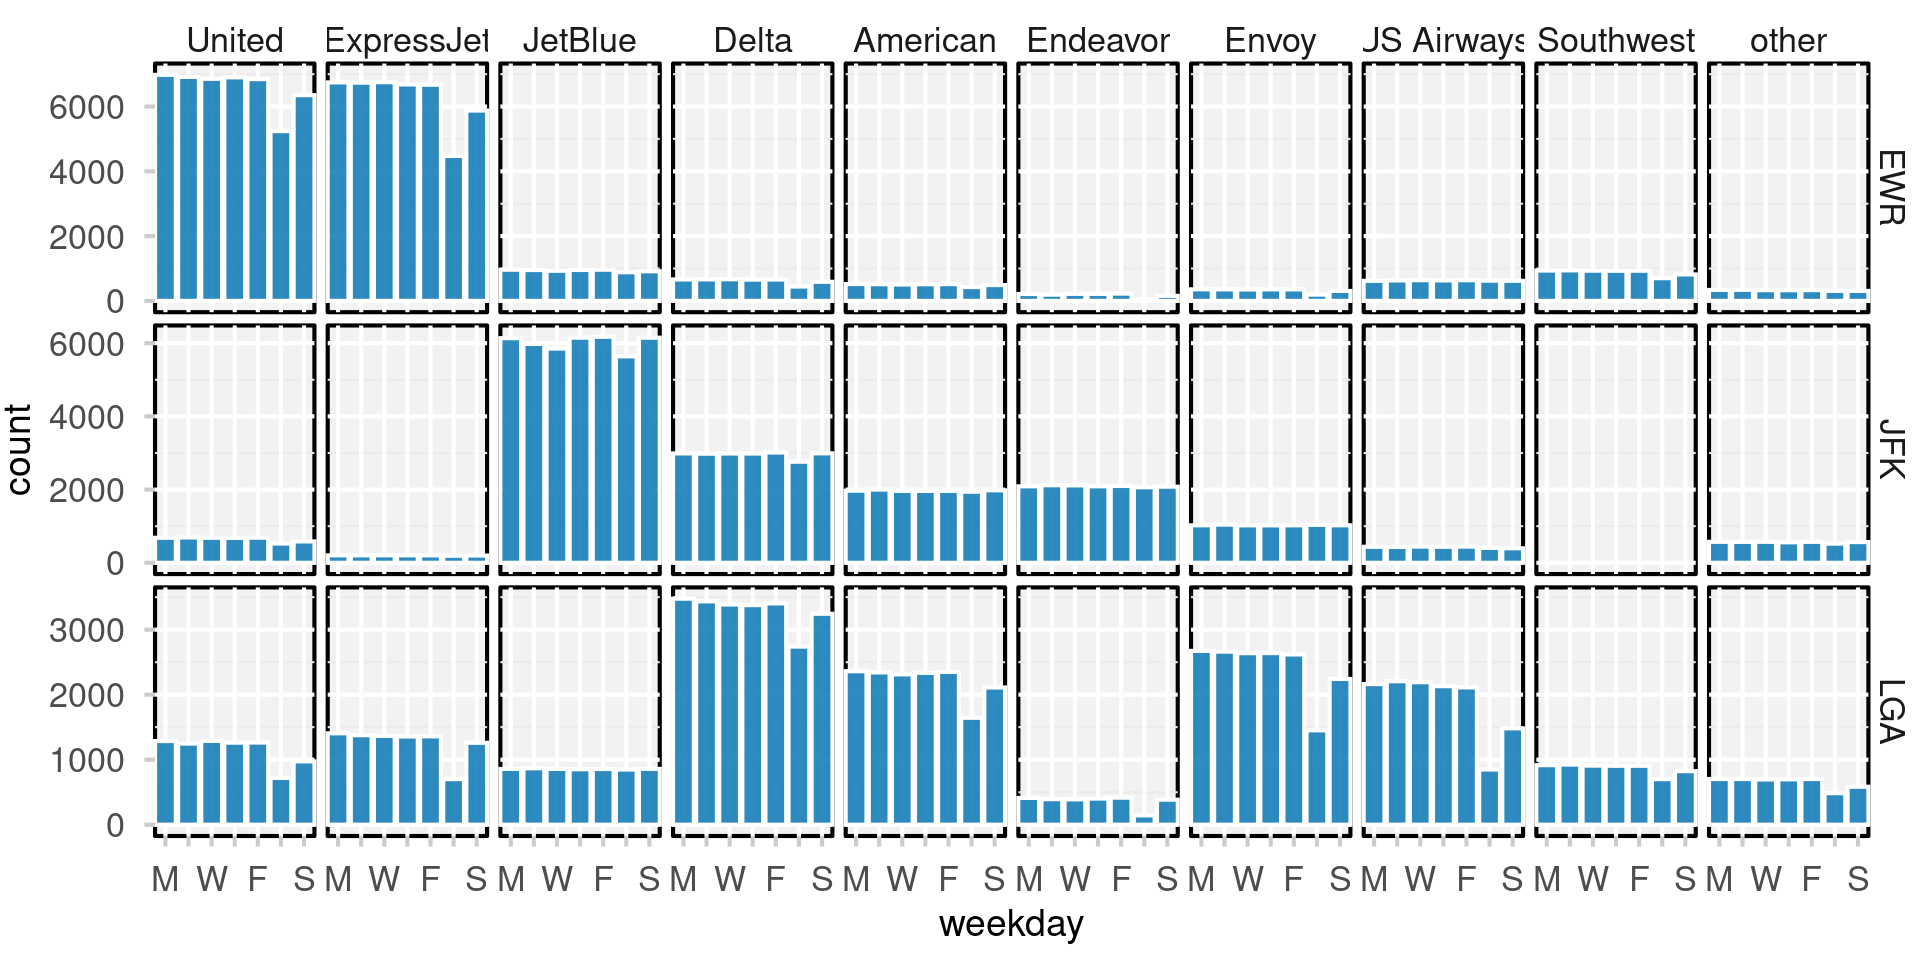
Complexity Hid the Story?
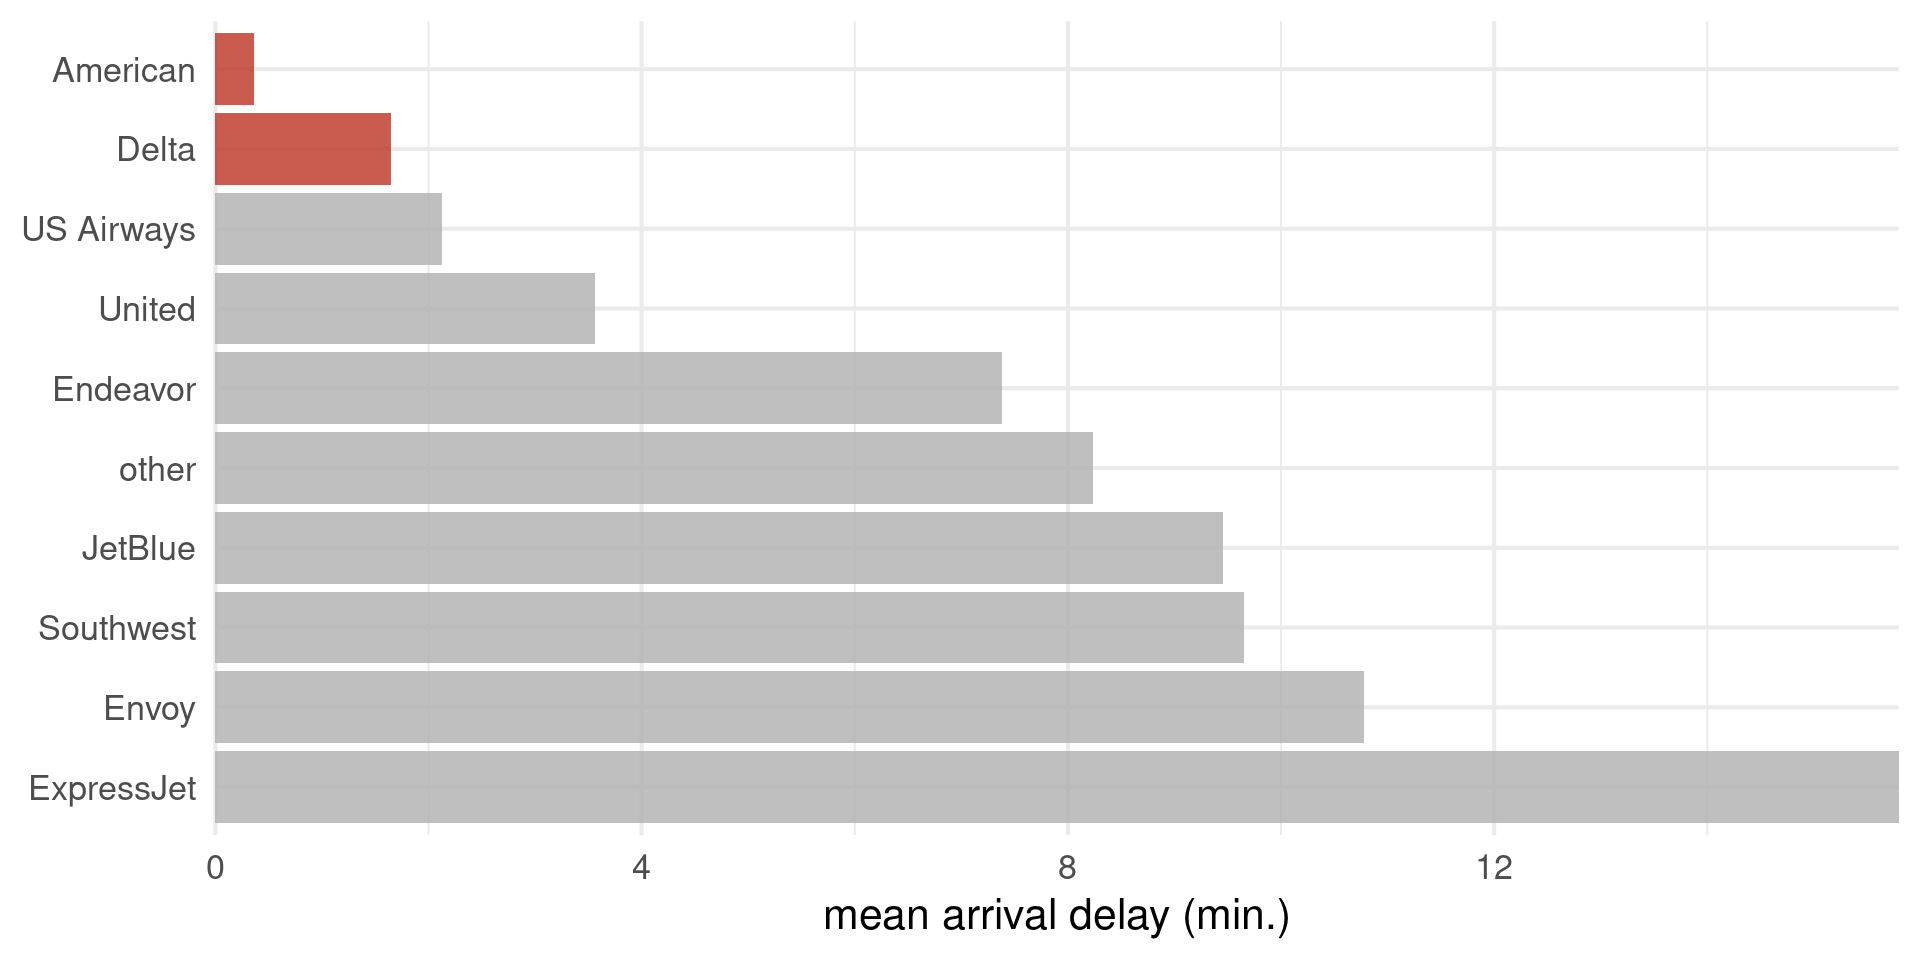
Build up to complexity

  • Sometimes a complex plot is required
  • Don’t lead with complexity
    • Instead show something simpler first
    • Primes your audience to understand the complex figure

Start Simple

  • Here show a single panel first (or aggregate over all carriers)
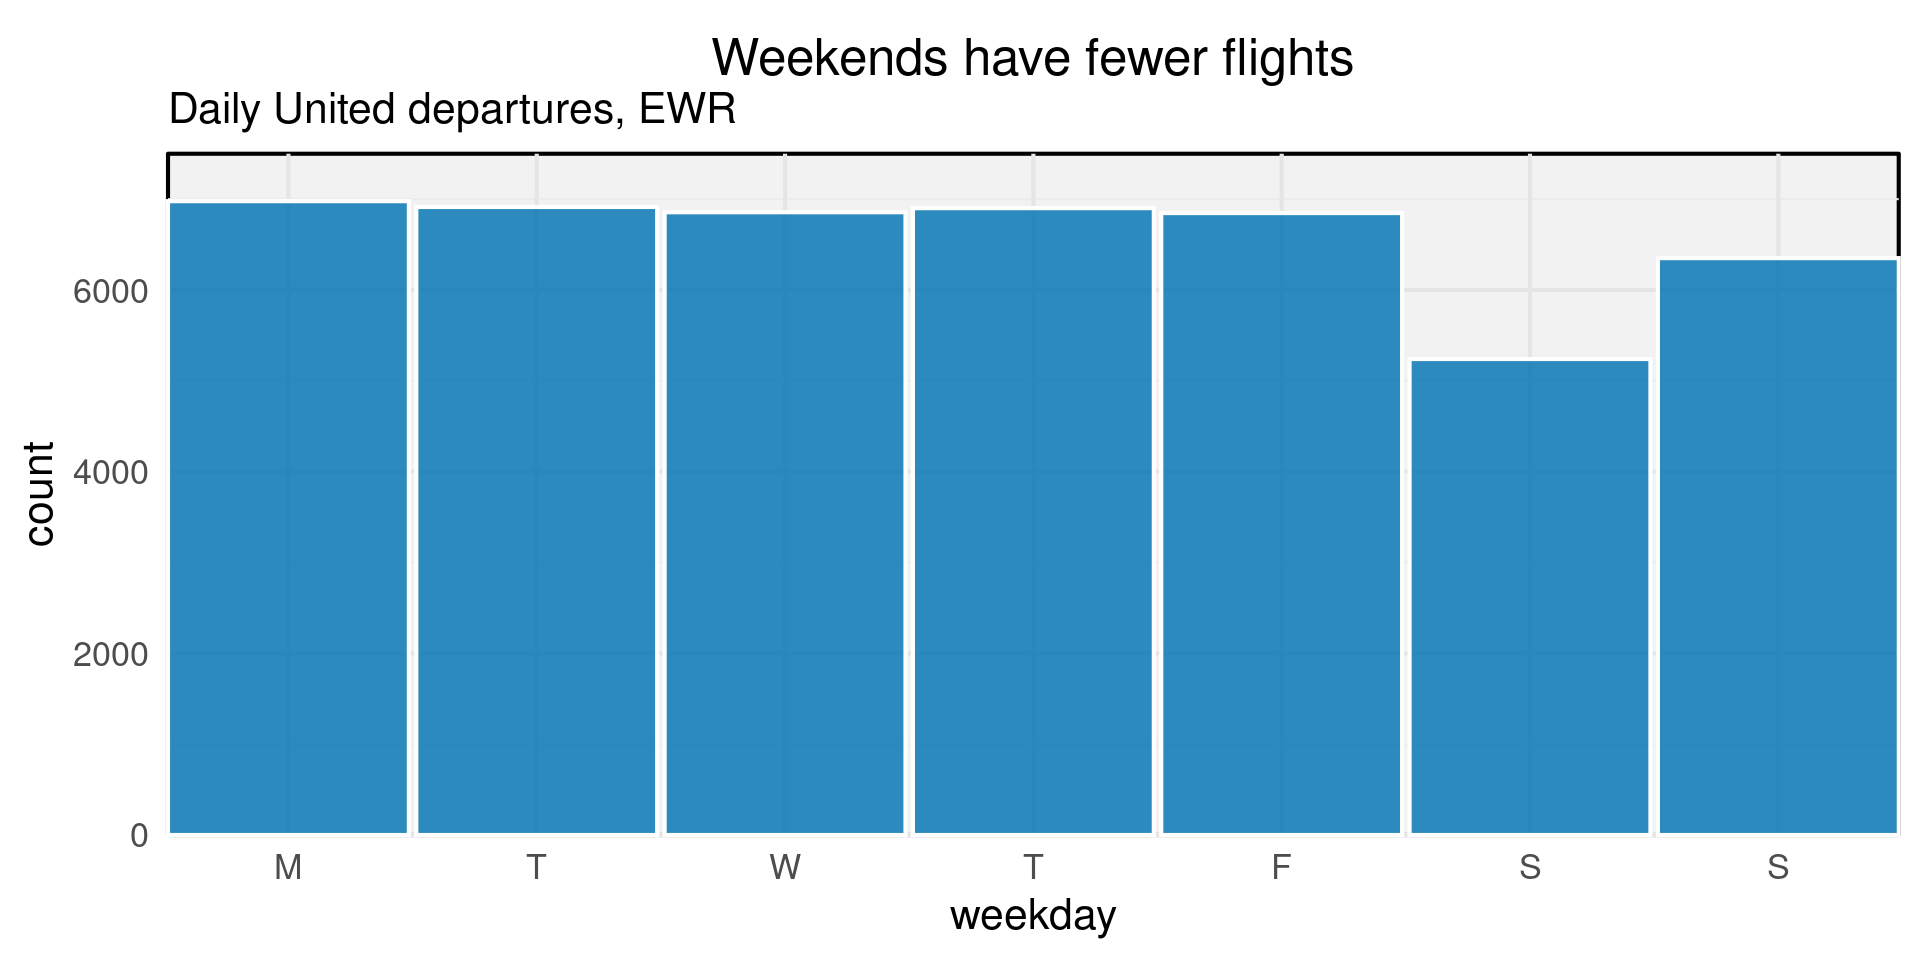
Then go Complex
Thanks!