DATA 622 Meetup 8: Trees and Ensemble Methods
2026-03-16
Week Summary
- Pushed MVP Demo to Week After Spring Break
- Lab 5 Available, due in two weeks
- Reading:
- Chapter 8 in ISLP (skip BART until Causal Inference week)
- Chapter 6 and 7 (up to boosting) in HOML
- One Vignette on Random Forests and Decision Trees
Save the Date March 25th 6:30PM!
![]()
Save the Date March 25th!
- Sign up here: Sign up Link
- Tell your classmates just in case
Spring Pitchfest!
![]()
![]()
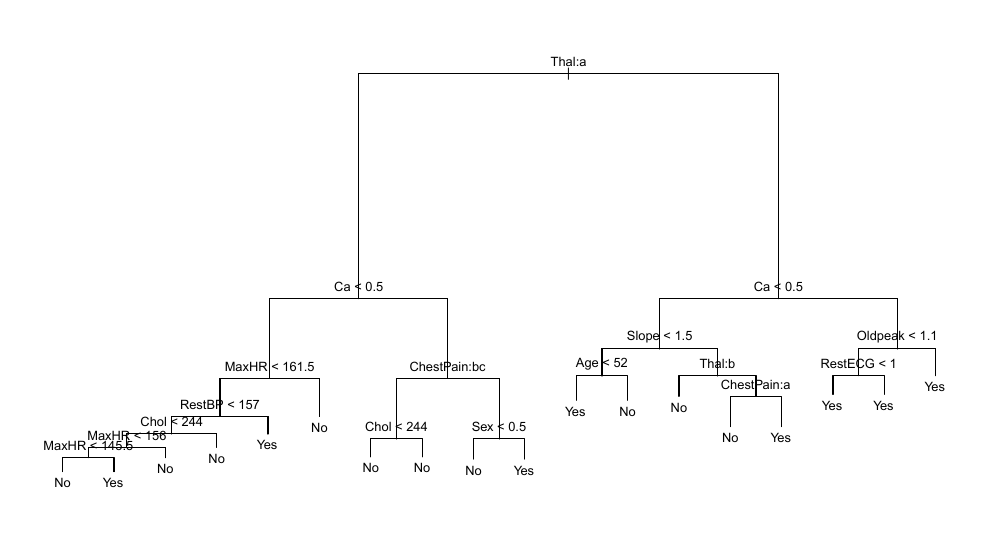
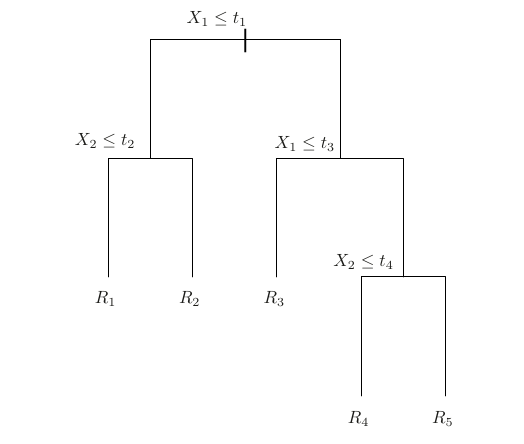
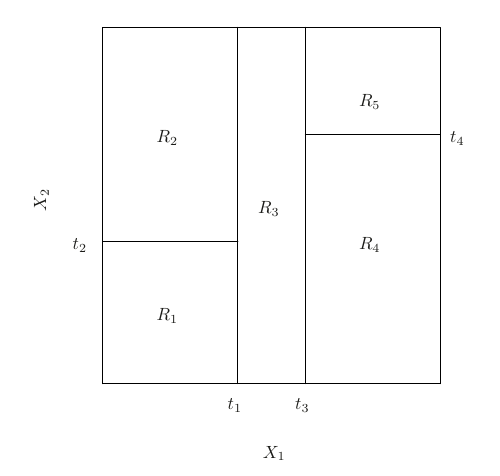
Decision Trees
- Decision Trees divide predictors space into regions
![]()
8.6 ISLP
Decision Trees
- Predictions made using training data that falls into each region
![]()
8.6 ISLP
Previous Models Easy to Solve
- Previous Models:
- Linear Regression
- Logistic Regression
- GLMs
- Support Vector Machines
Learning algorithms for these models guarantee finding the “best” solution
Models for Rest of the Class Hard to Solve
- Rest of Class:
- Decision Trees
- Neural Networks
It will NOT be possible to find the one best model for your data
- It becomes much more about finding good solutions
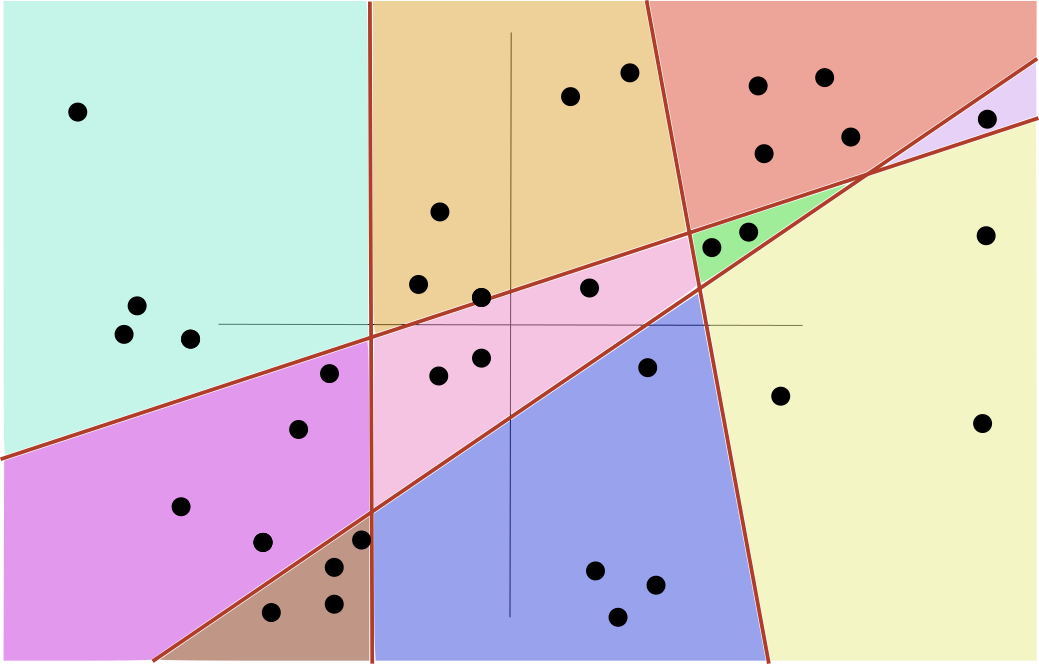
Goal of Decision Trees
- Idea is to implement a method called “Piecewise constant regression”
![]()
Goal of Decision Trees
- Each value of predictors falls in a region
![]()
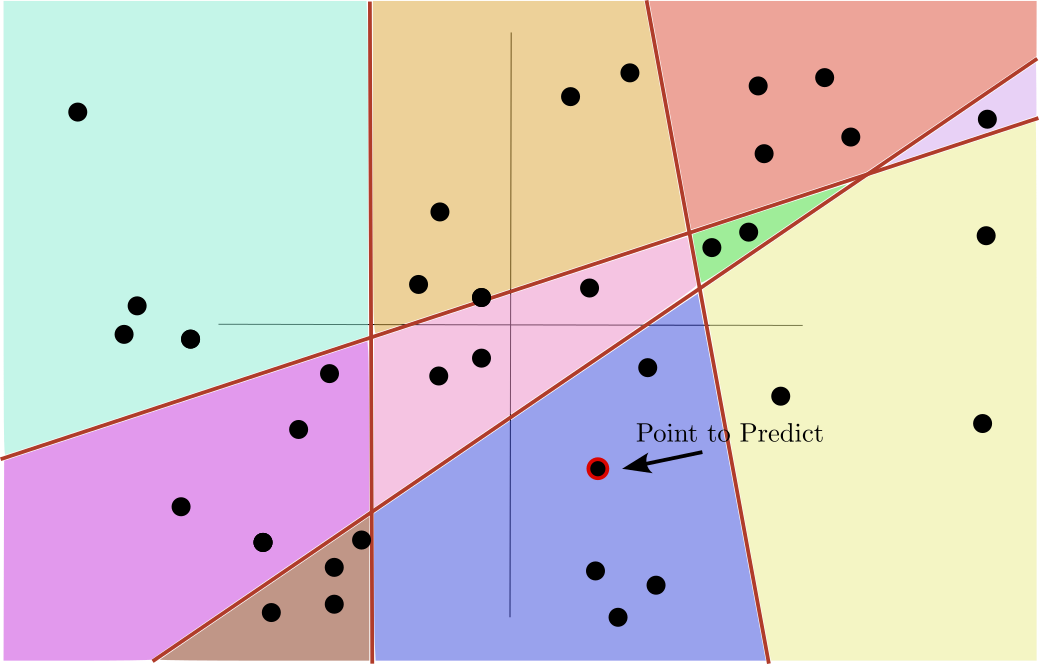
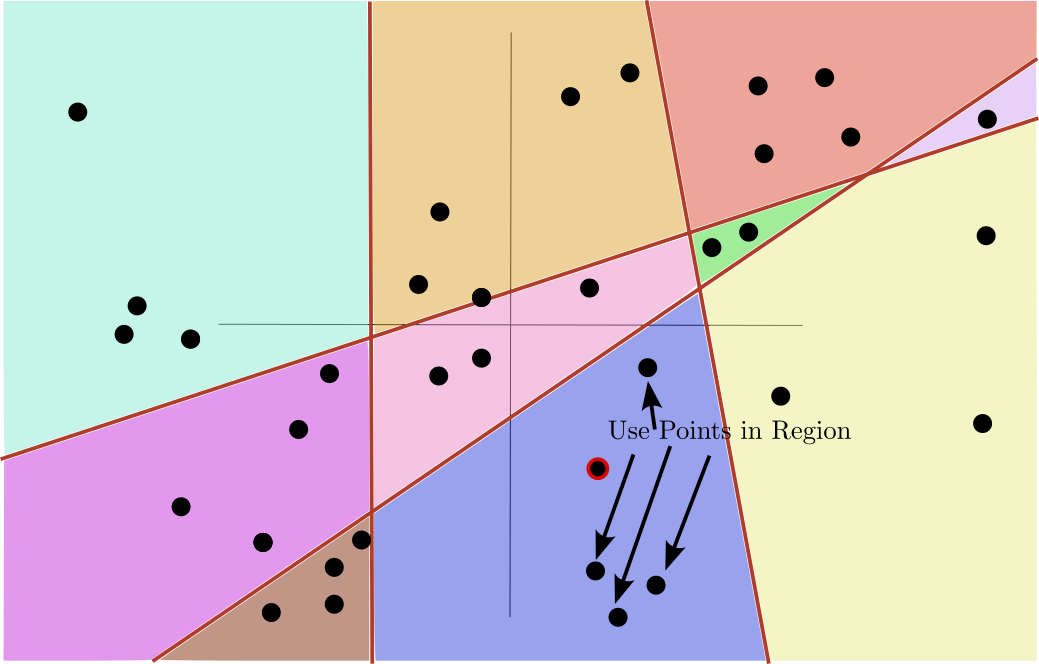
Goal of Decision Trees
- Use the values in the region to predict
![]()
Goal of Decision Trees
- Mean or median for regression
![]()
Goal of Decision Trees
- Majority vote for classification
![]()
Binary Recursive Split
- Decision tree algorithms use binary trees to define regions
Binary Recursive Split
- Nodes split “parent” set into “child” sets based on a condition
Greedy Splits
- At each step: Consider all splits, and all predictors.
- Find Best split
- Regression: Reduction in MSE \[
\Delta_{\mathrm{split}} = \quad n\text{MSE}_{\textrm{parent}} - \left(n_L \cdot \textrm{MSE}_L + n_R \cdot \textrm{MSE}_R\right)
\]
- Stop when too many leaves, too much depth, or too few points in a split
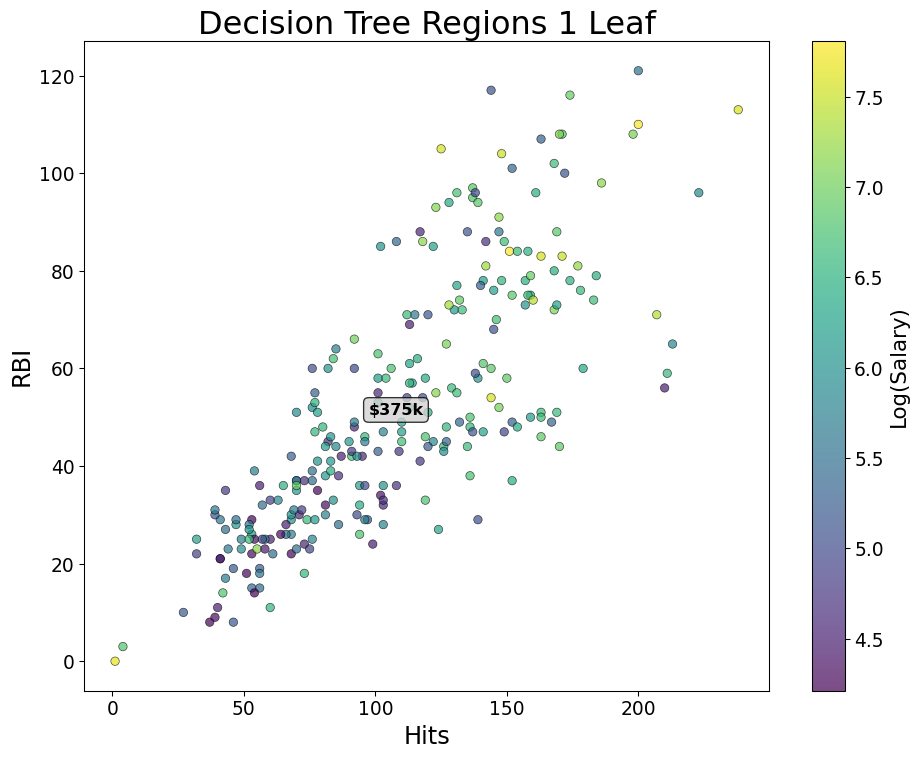
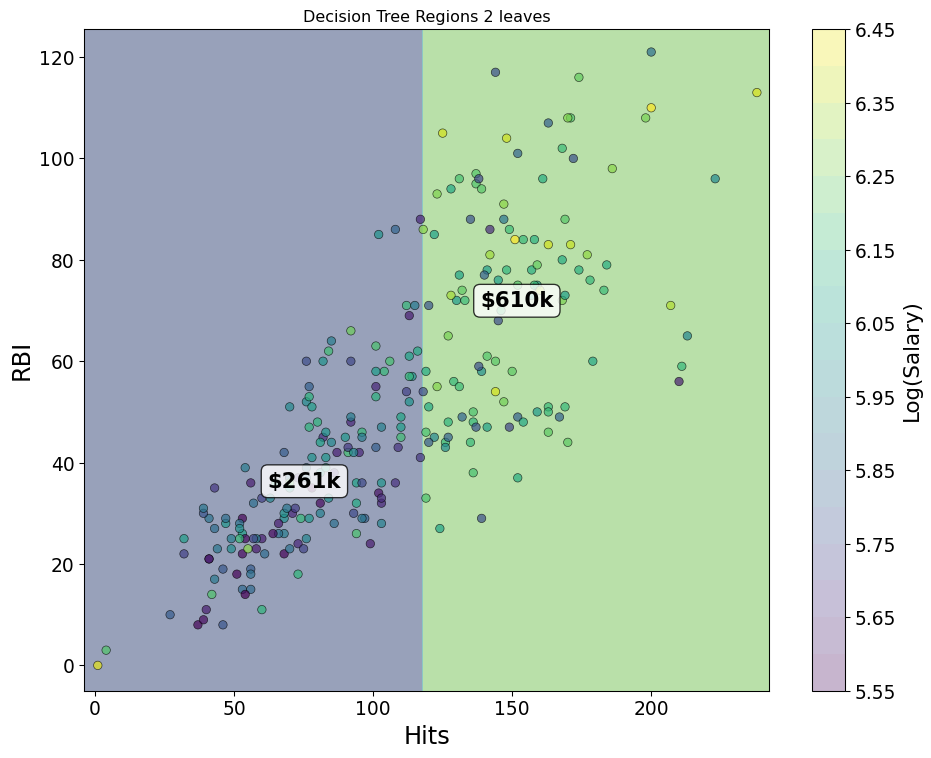
Greedy Splits
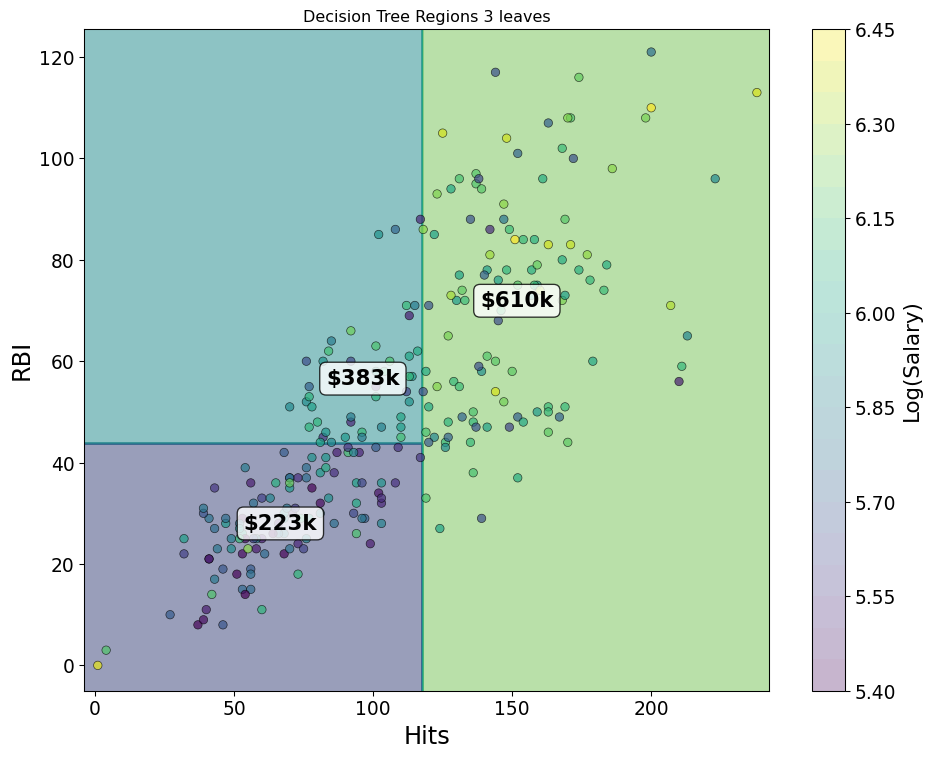
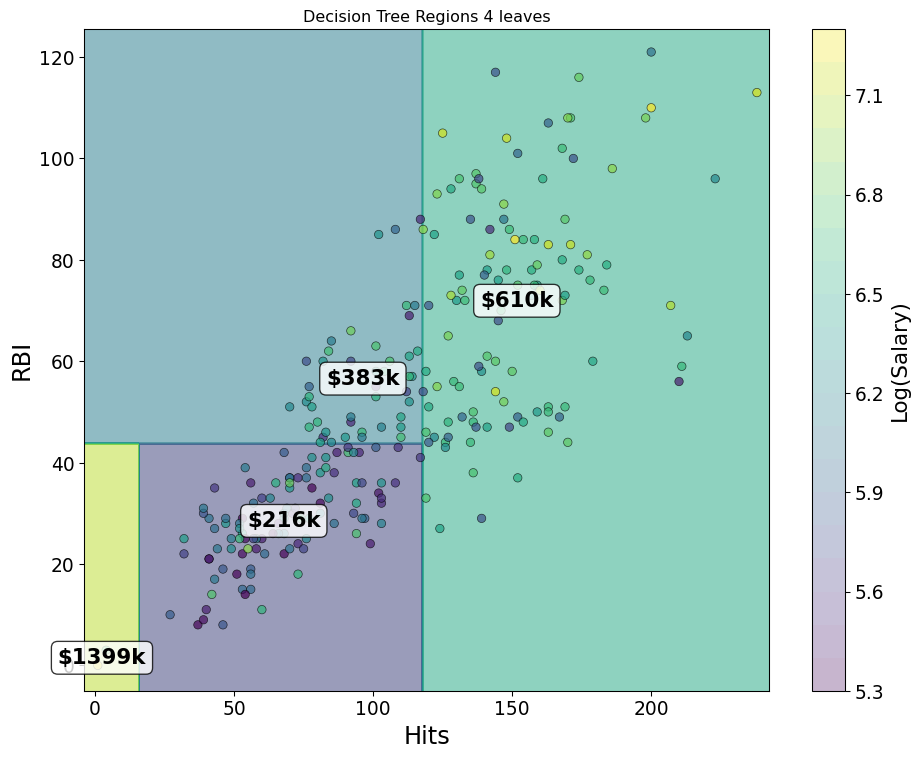
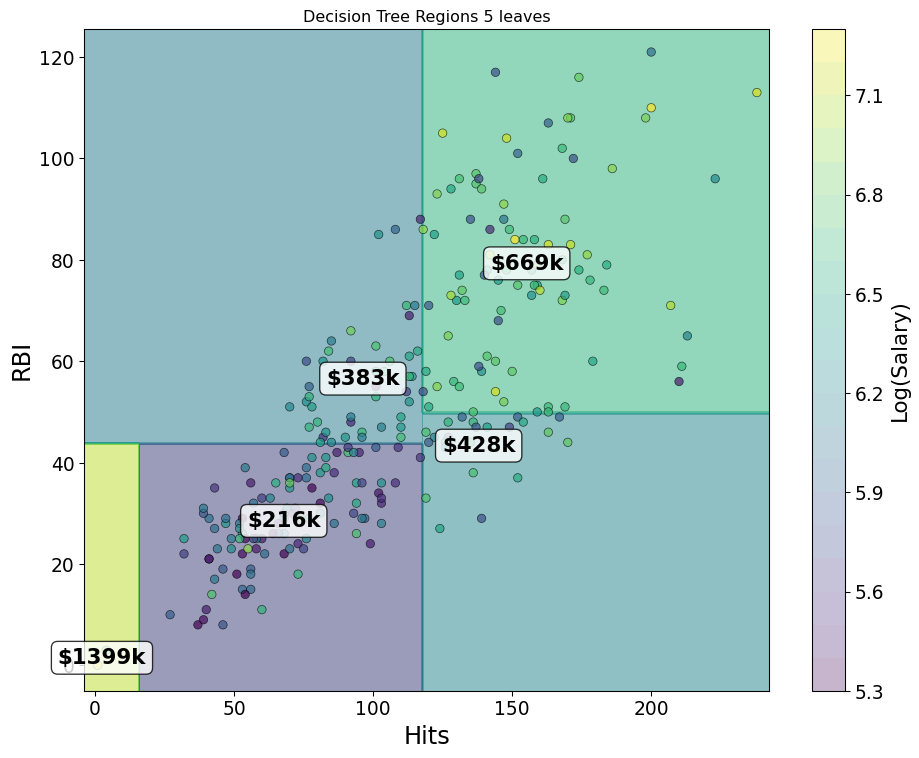
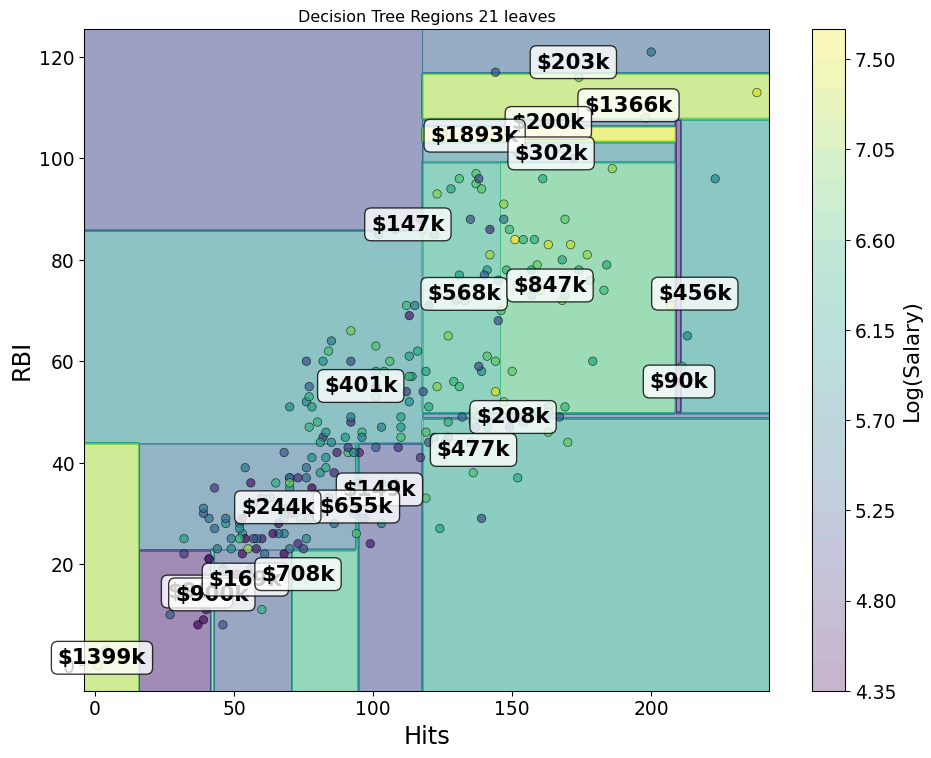
- Start with “Hitters” and log salary versus RBIs and Hits
![]()
Greedy Splits
![]()
Greedy Splits
![]()
Greedy Splits
![]()
Greedy Splits
![]()
Greedy Splits
![]()
Classification
- Instead of accuracy, pick variable and splits using evenness:
- Gini Impurity: \(\sum_{k}\hat{p}_k(1-\hat{p}_k)\)
- Entropy: \(-\sum_{k}\hat{p}_k\log \hat{p}_k\)
- Pick variable and split to give maximum reduction of weighted Gini or entropy
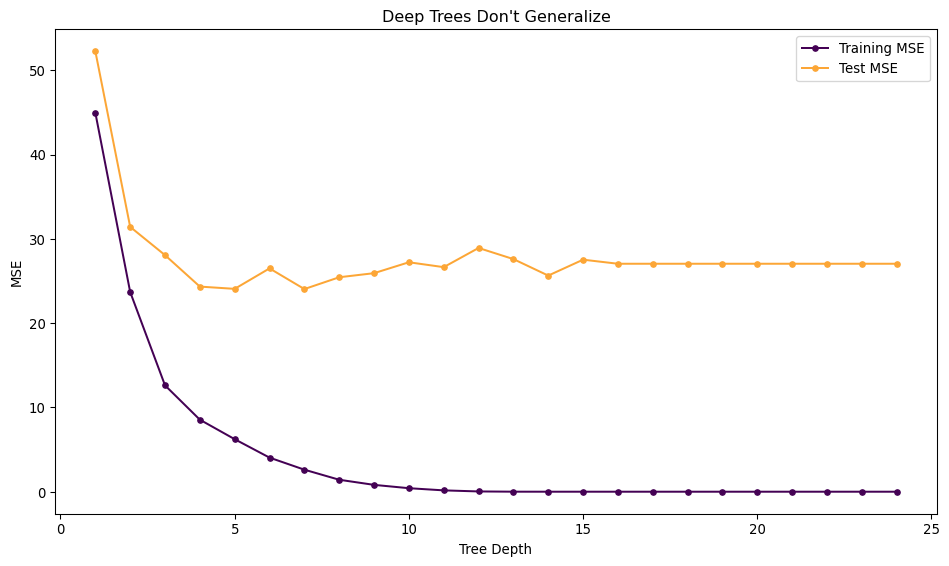
Trees are Low Bias and High Variance
![]()
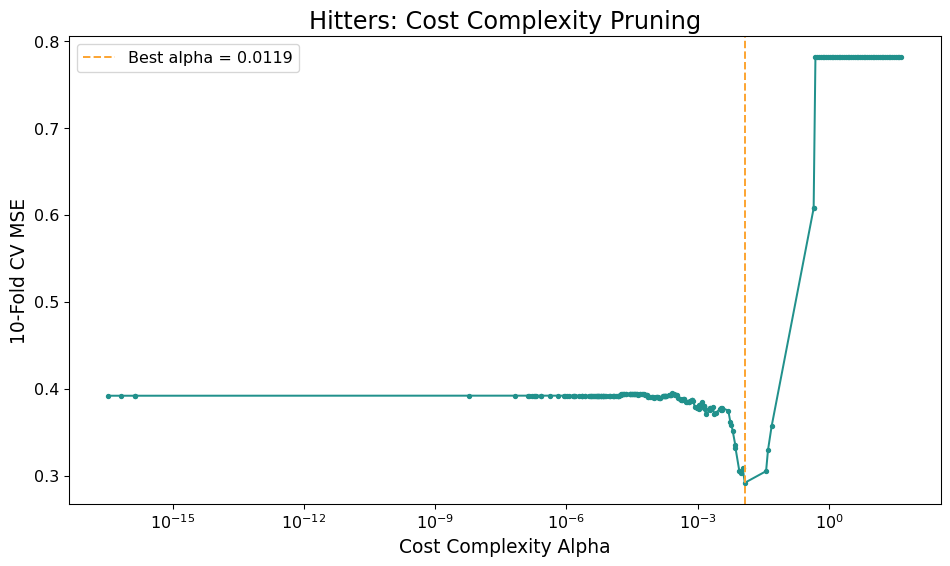
Pruning Regularizes Trees
- Common strategy is to build a large tree and then use regularization to pick a sub-tree
- Cost-Complexity Pruning Penalty \(\alpha\)
- Pick tree with lowest penalized error: \[
\mathrm{argmin}_{T\subset T_0} \sum_{i=1}^n (y_i - T(\mathbf{x}_i))^2 + \alpha |T|
\]
- \(|T|\) is number of terminal nodes
Best \(\alpha\) with CV
![]()
Wisdom of the Crowds
- Statistician went to 1908 Plymouth County Fair:
- Polled 800 townsfolk on weight of a cow
![]()
Oil Painting of Craven Heiffer 1811
Wisdom of the Crowds
- Crowd Median: 1198 pounds
- Actual Weight: 1202 pounds
![]()
Oil Painting of Crave Heiffer 1811
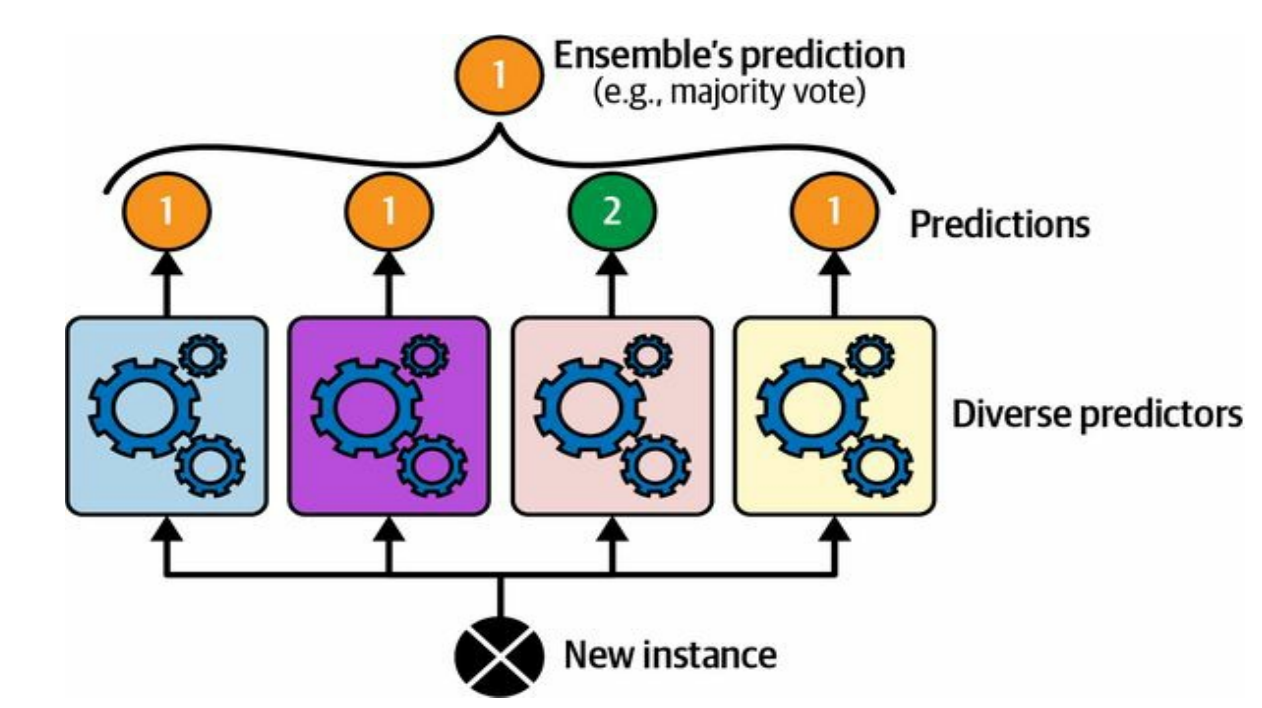
Ensemble Learning
- Combine predictions of several methods
![]()
HOML 7.2
Ensemble Learning
- Different models make errors in different ways
- Combining them leads to complementary insights
- Stacking: Train a final model to combine outputs of different models
- Netflix Prize did this with Neural Networks and Matrix factorization methods, kNN
- Mixture of Experts for LLMs
When does it help?
- Consider errors from two models, \(\delta_1\) and \(\delta_2\)
- Average them together and compute variance: \[
\mathrm{Var}(\frac{1}{2}\delta_1 + \frac{1}{2}\delta_2) = \frac{1}{4}\mathrm{Var}(\delta_1) + \\
\frac{1}{4}\mathrm{Var}(\delta_1) + \frac{1}{2}\mathrm{Cov}(\delta_1,\delta_2)
\]
- If models are same, makes no difference
- If models make different errors and accuracy is similar, improve error
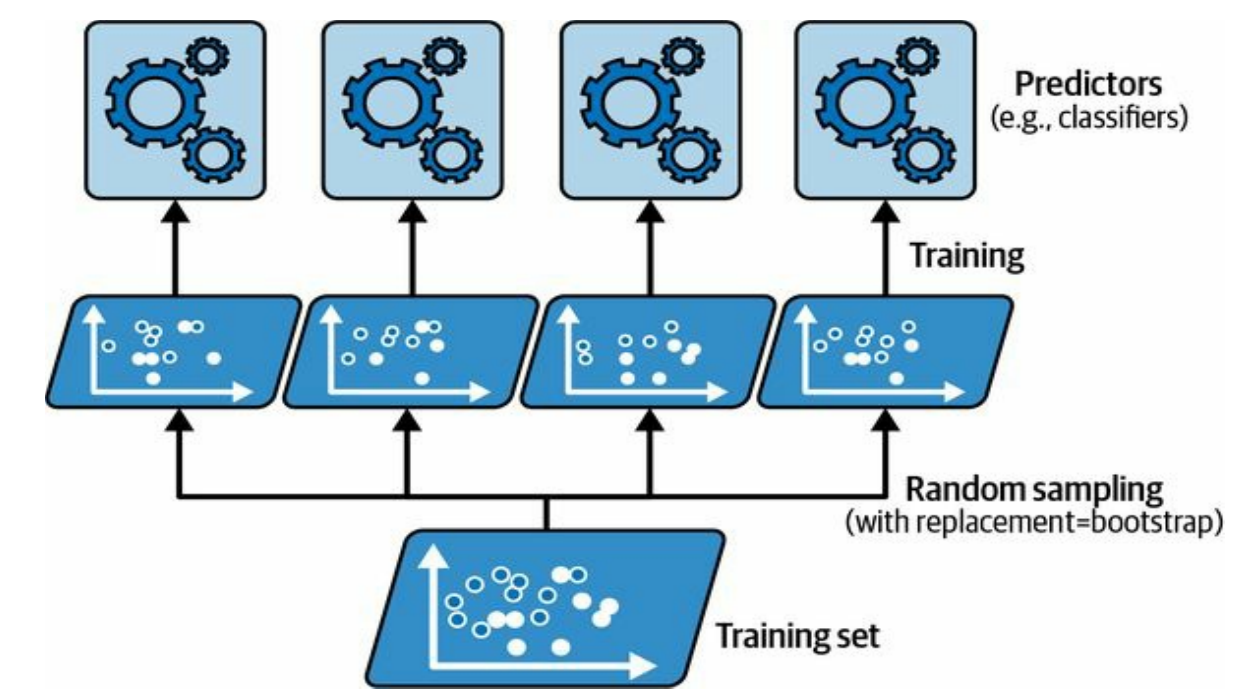
Bagging
- You can also combine models from the same class trained with different features or data:
![]()
HOML 7.4
Bagging
- Generate a lot of trees, each tree generalizes poorly
- Average or poll their predictions to reduce variance \[
\hat{g}_{\mathrm{bag}}(\mathbf{x}) = \frac{1}{B} \sum_{j=1}^B \hat{g}_{j}(\mathbf{x})
\]
Bagging Classification
- Generate a lot of trees, each tree generalizes poorly
- Average or poll their predictions to reduce variance
\[
\hat{g}_{\mathrm{bag}}(\mathbf{x}) = \mathbf{argmax}_{y\in Y} \sum_{j=1}^N I(\hat{g}_j(\mathbf{x}) = y)
\]
Where do the \(g\)s come from?
- Goal: Generate trees that have learned, but are different from each-other
- Bootstrap Aggregating
- Fit each tree to Bootstrap Sample of Data
Bagging can be applied to any statistical model, but most common for decision trees
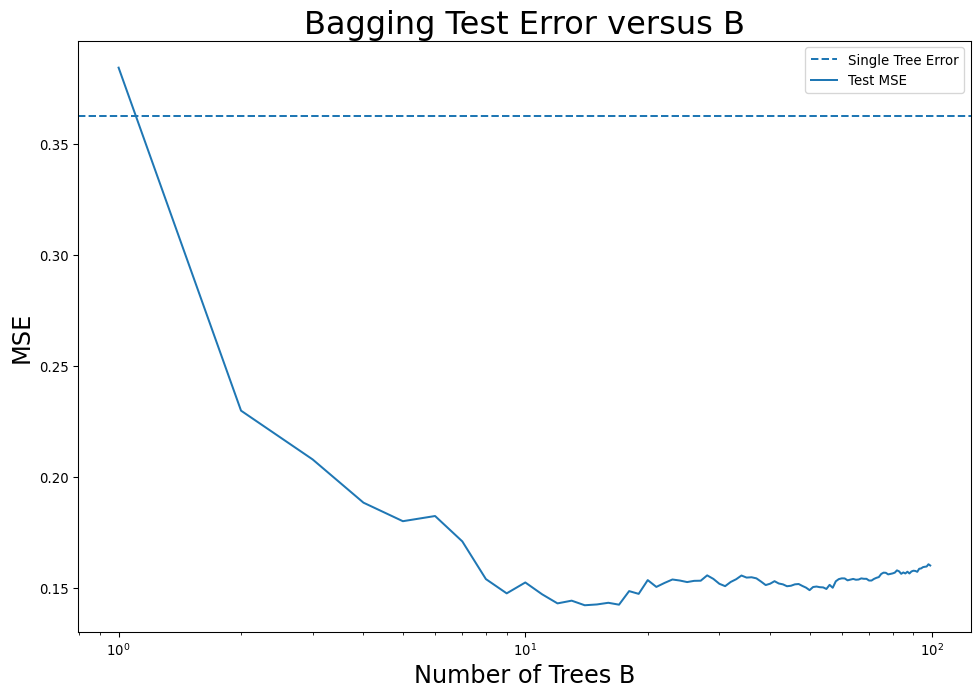
How many trees to bag?
- Model improves as \(B\) increases, up until a point
- Adding more trees doesn’t increase test error
![]()
Decreasing the Variance by Decorrelating Trees
- Improvement from Bagging was modest
- Trees tend to be similar to each-other even though different bootstrap samples
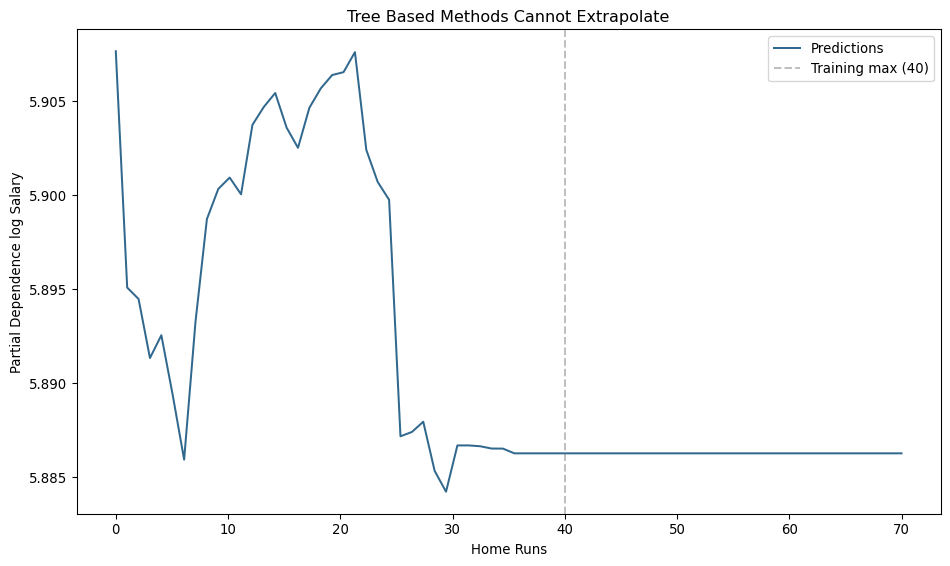
Random Forest: For each split, randomly select a certain number of features less than the total.
- Forces trees to be less correlated
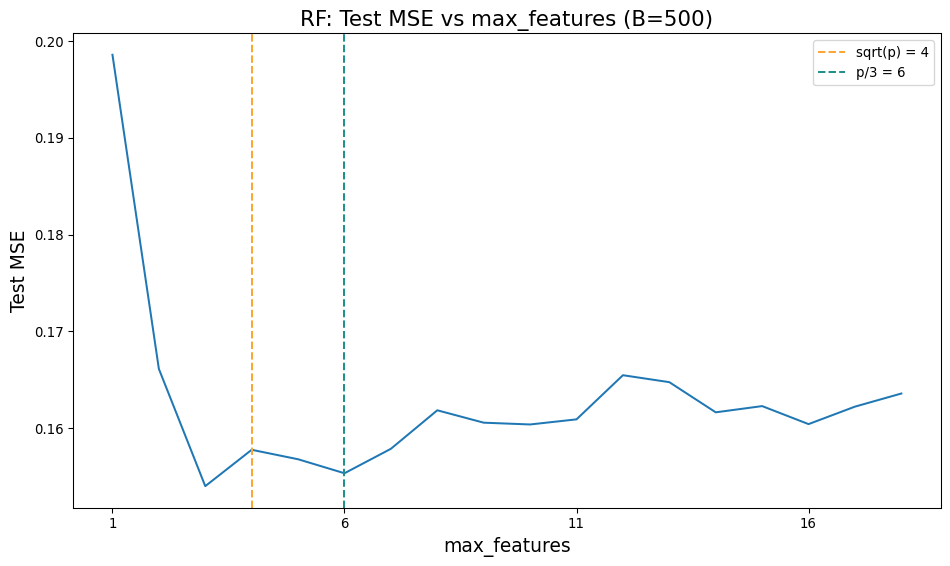
Random Forests
- Can try any value of ‘max_features’ from 1 to \(p\)
- \(p/3\) for regression, \(\sqrt{p}\) for classification
![]()
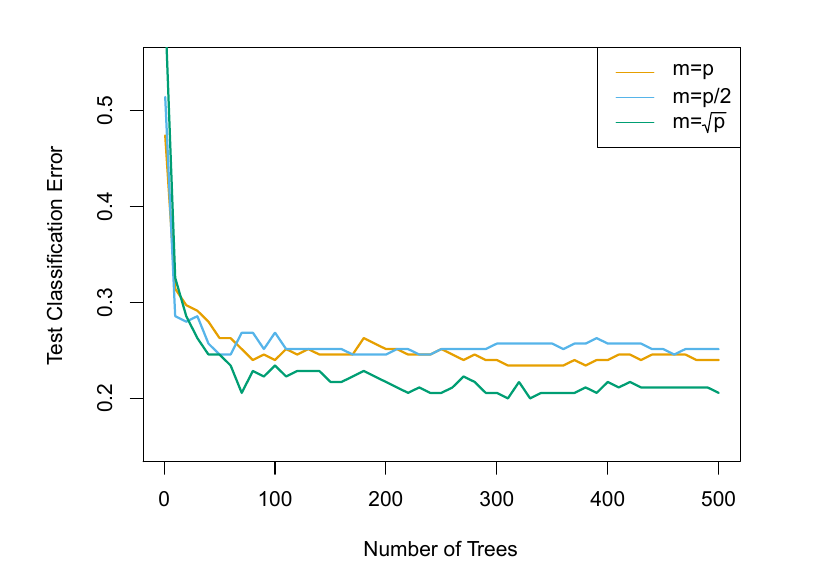
Random Forest Classification
- 15 Class Gene Expression data with 500 features
![]()
ISLP 8.10
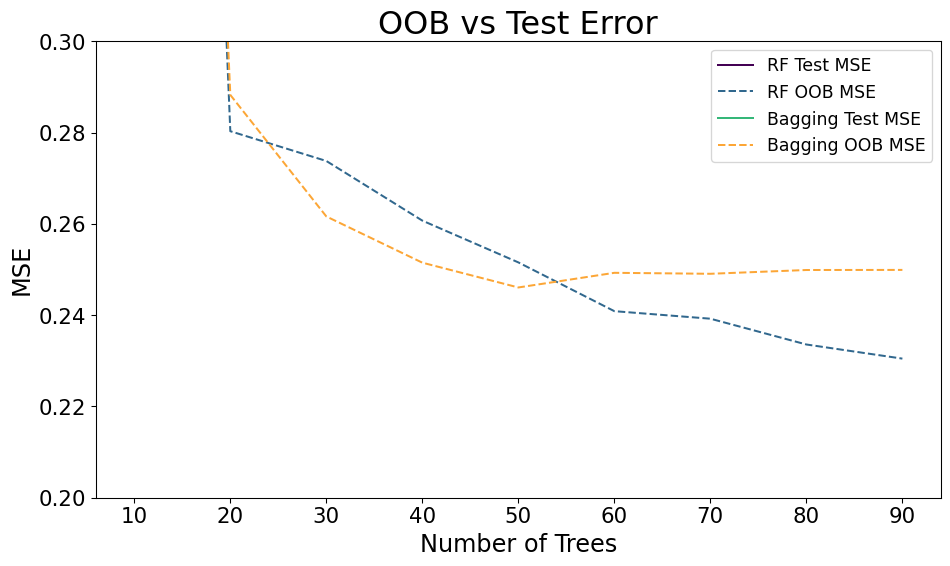
Out Of Bag Error
- 1/3rd of data doesn’t get chosen each sample
- Can use those data to estimate error
![]()
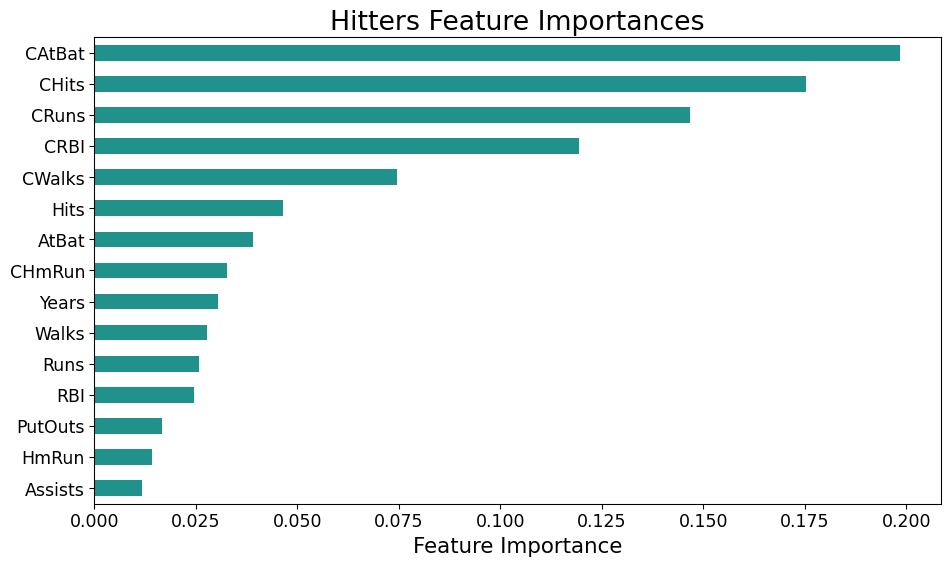
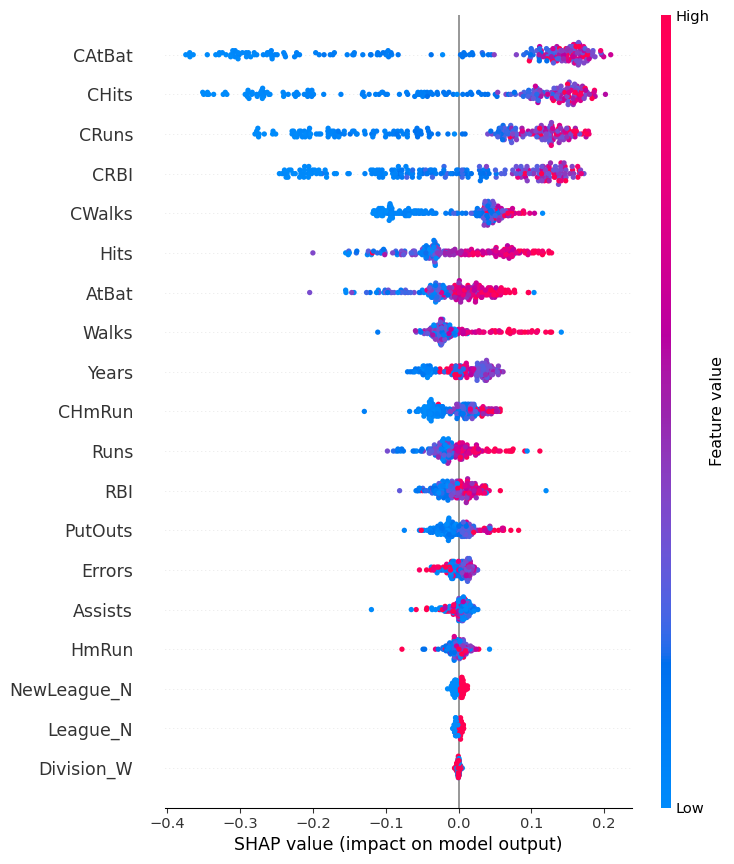
Feature Importance
![]()
Feature Importance
- We are building up to something like this:
![]()